Apple Price Trend and Forecast
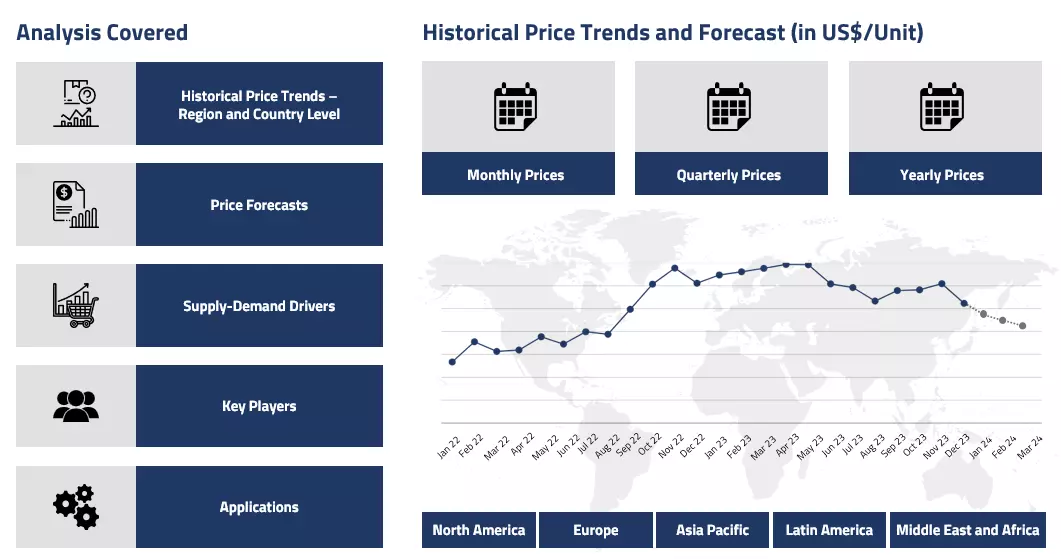
Apple Regional Price Overview
Get the latest insights on price movement and trend analysis of Apples in different regions across the world (Asia, Europe, North America, Latin America, and the Middle East & Africa).
Apple Price Trend for the Second Half of 2024
In H2 2024, apple prices in global markets followed a fluctuating trend. In India, prices varied month-on-month due to weather-related disruptions. Erratic rainfall, heatwaves, and insufficient cold spells affected early-season yields, limiting the supply of domestic apples and driving demand for imported varieties such as New Zealand Galas and Turkish Red Delicious. Despite weather uncertainties, apple production in Himachal Pradesh remained stable, providing growers with consistent pricing.
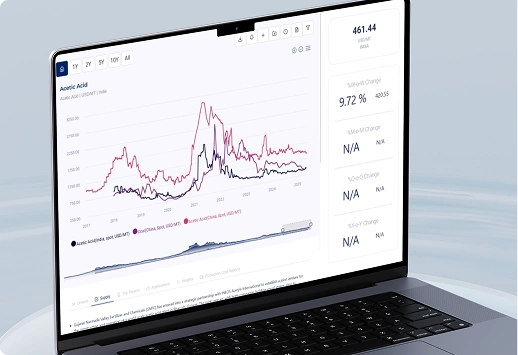
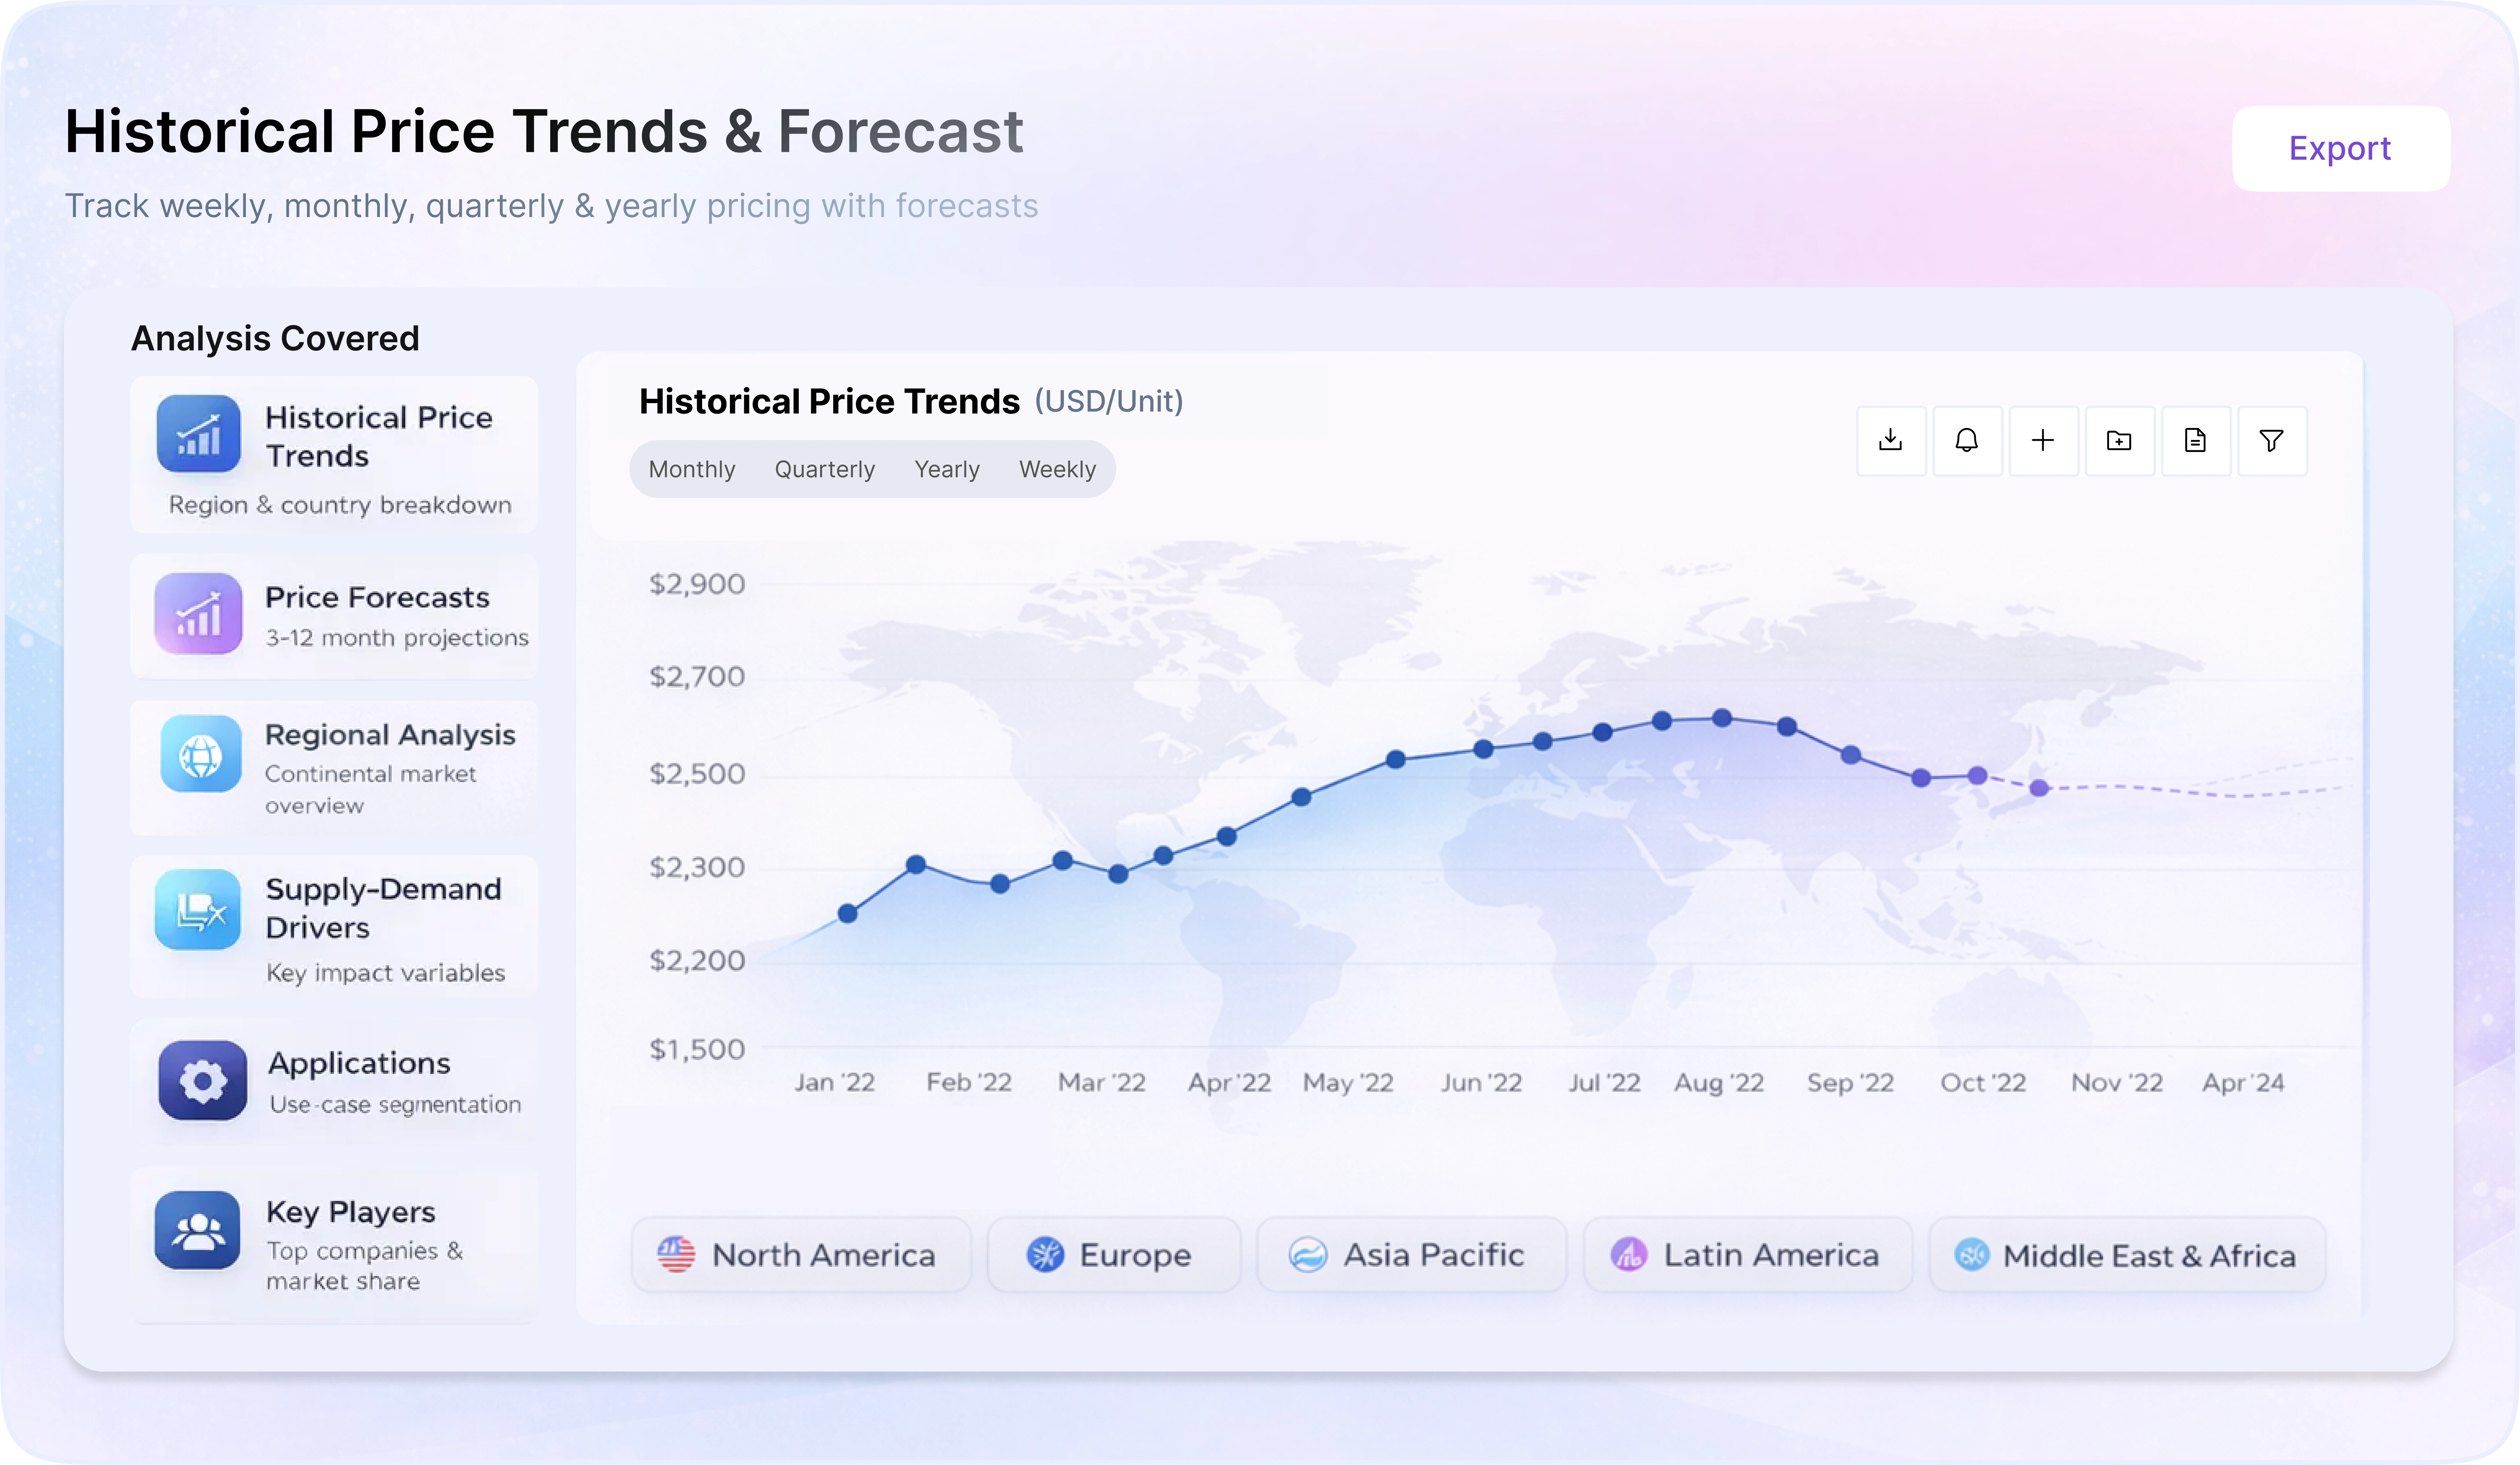
Apple Price Chart
Please Login or Subscribe to Access the Apple Price Chart Data
In contrast, production in other regions was significantly impacted by spring rains followed by dry spells, leading to lower yields. The reduced harvest initially pushed prices upward, benefiting growers. However, as supply levels improved, prices stabilized in the market. The arrival of imported apples further eased supply constraints, ensuring a balanced market.
Analyst Insight
According to Procurement Resource, the fluctuating nature of the agricultural commodity's pricing will continue to cause price variations in global markets influenced by the production constraints due to severe winter conditions in the coming months.
Apple Price Trend for the First Half of 2024
In the first half of 2024, apple prices in global markets exhibited a mixed trend, influenced by high production levels, fluctuating demand, and international trade dynamics. The U.S. apple industry faced significant supply pressures due to record storage volumes from the previous season, leading to deflationary pricing and squeezing grower margins. Despite lower domestic prices, labor costs surged, further impacting profitability. Increased exports helped alleviate excess supply, with India emerging as a key market after trade barriers eased.
However, competition from other fruit categories and rising input costs limited price recovery. In Europe, unpredictable weather patterns, including early frosts and dry spells, affected yields, creating localized supply shortages that offset the global surplus to some extent. Meanwhile, reduced imports in key consuming regions such as the U.S. and EU further reshaped market dynamics. Overall, the apple market in H1 2024 was characterized by price volatility, supply imbalances, and ongoing cost pressures for growers.
Analyst Insight
According to Procurement Resource, apple prices are likely to remain fluctuating in the coming months as well. Regional variations are anticipated going forward.
Apple Price Trend for the Second Half of 2023
The fruit growers in Kashmir enjoyed a surge in their production returns as traditional apple varieties commanded higher prices in the market in the last two quarters of 2023. Compared to previous years of struggle and minimal profits, growers now witnessed an increased demand and substantial profits, with some reporting double the prices from last year.
In addition to this, government assistance has facilitated smoother transportation, resulting in better returns for farmers as the supply sector was able to meet the requirements of consumer demand without any delay. This upturn was a significant relief for an industry that faced substantial losses in the previous quarters. Although this year's production has decreased, steady and strong demand offers hope for sustained relief in the industry.
Analyst Insight
According to Procurement Resource, the price trend of Apple is expected to maintain its uproar in the next few quarters, too, as the limited production rates and overpowering demand might cause an imbalance in supply-demand equilibria.
Apple Price Trend for the First Half of 2023
In China and other apple-growing Asian countries, the rates of production in the first two quarters of 2023 declined by almost 5%. The major cause of the fall in the produce was unfavorable weather conditions like unseasonal rains, extreme temperatures, and hailstorms, especially in top apple-producing regions in China such as Shaanxi and Shandong. Not only the Asian regions but the US markets were also adversely affected by similar causes as the production slipped to the lowest possible levels since 2012.
As a result of reduced supplies, exports to the United States declined for a third straight year, falling to their lowest level since 2003–04 at alarming levels. In addition to this, Cyclone Gabrielle's effects on New Zealand's export supply also had a negative impact on crops and raised concerns in the industry. The cyclone's overall impact is anticipated to result in a 60,000-ton decrease in production to 453,000 tons and a more than 20% decrease in exports.
Overall, the supply of apples globally remained restricted due to a number of causes, climate change being the most significant of them. However, the demand for apples around the globe only saw an incline, pushing its prices towards a northward trajectory.
Analyst Insight
According to Procurement Resource, the price of Apples is expected to showcase a mixed trend as the restricted supply will likely fall short of managing the demand from the consumer sector.
Procurement Resource provides latest prices of Apple. Each price database is tied to a user-friendly graphing tool dating back to 2014, which provides a range of functionalities: configuration of price series over user defined time period; comparison of product movements across countries; customisation of price currencies and unit; extraction of price data as excel files to be used offline.
Our Clients


Procurement Resource Database
Turn price intelligence into action with the Procurement Resource Database. Log in or subscribe to unlock live price trends, historical charts, supplier databases, cost curves, and analyst-backed insights across chemicals, agriculture, energy, packaging, and more. Use these tools to benchmark your contracts, plan budgets with confidence, and stay ahead of market moves on every product you buy.
Apple Dashboard Inclusions
0
+Products
0
+Regions
0
+Subscriptions
About Apple
Apples are one of the most cultivated and consumed fruits around the world, which is available in various colors such as red, green, and yellow. It has a sweet taste, crisp texture, tart flavor and is often eaten as a fresh snack. It is also employed in various culinary applications such as pies, applesauce, juices, etc. They are also a source of essential nutrients and dietary fiber.
Apple Product Details
| Report Features | Details |
| Product Name | Apple |
| Industrial Uses | Flavoring and extracts, Cider production, Pectin extraction, Fragrances |
| HS Code | 080810 |
| Supplier Database | Washington Fruit & Produce Co , Auvil Fruit Co Inc, Symms Fruit Ranch Inc, Stemilt Growers LLC, Jewel Apple Ltd, Gilbert Orchards |
| Region/Countries Covered | Asia Pacific: China, India, Indonesia, Pakistan, Bangladesh, Japan, Philippines, Vietnam, Iran, Thailand, South Korea, Iraq, Saudi Arabia, Malaysia, Nepal, Taiwan, Sri Lanka, UAE, Israel, Hongkong, Singapore, Oman, Kuwait, Qatar, Australia, and New Zealand Europe: Germany, France, United Kingdom, Italy, Spain, Russia, Turkey, Netherlands, Poland, Sweden, Belgium, Austria, Ireland Switzerland, Norway, Denmark, Romania, Finland, Czech Republic, Portugal and Greece North America: United States and Canada Latin America: Brazil, Mexico, Argentina, Columbia, Chile, Ecuador, and Peru Africa: South Africa, Nigeria, Egypt, Algeria, Morocco |
| Currency | US$ (Data can also be provided in local currency) |
| Supplier Database Availability | Yes |
| Customization Scope | The report can be customized as per the requirements of the customer |
| Post-Sale Analyst Support | 360-degree analyst support after report delivery |
Note: Our supplier search experts can assist your procurement teams in compiling and validating a list of suppliers indicating they have products, services, and capabilities that meet your company's needs.
Methodology
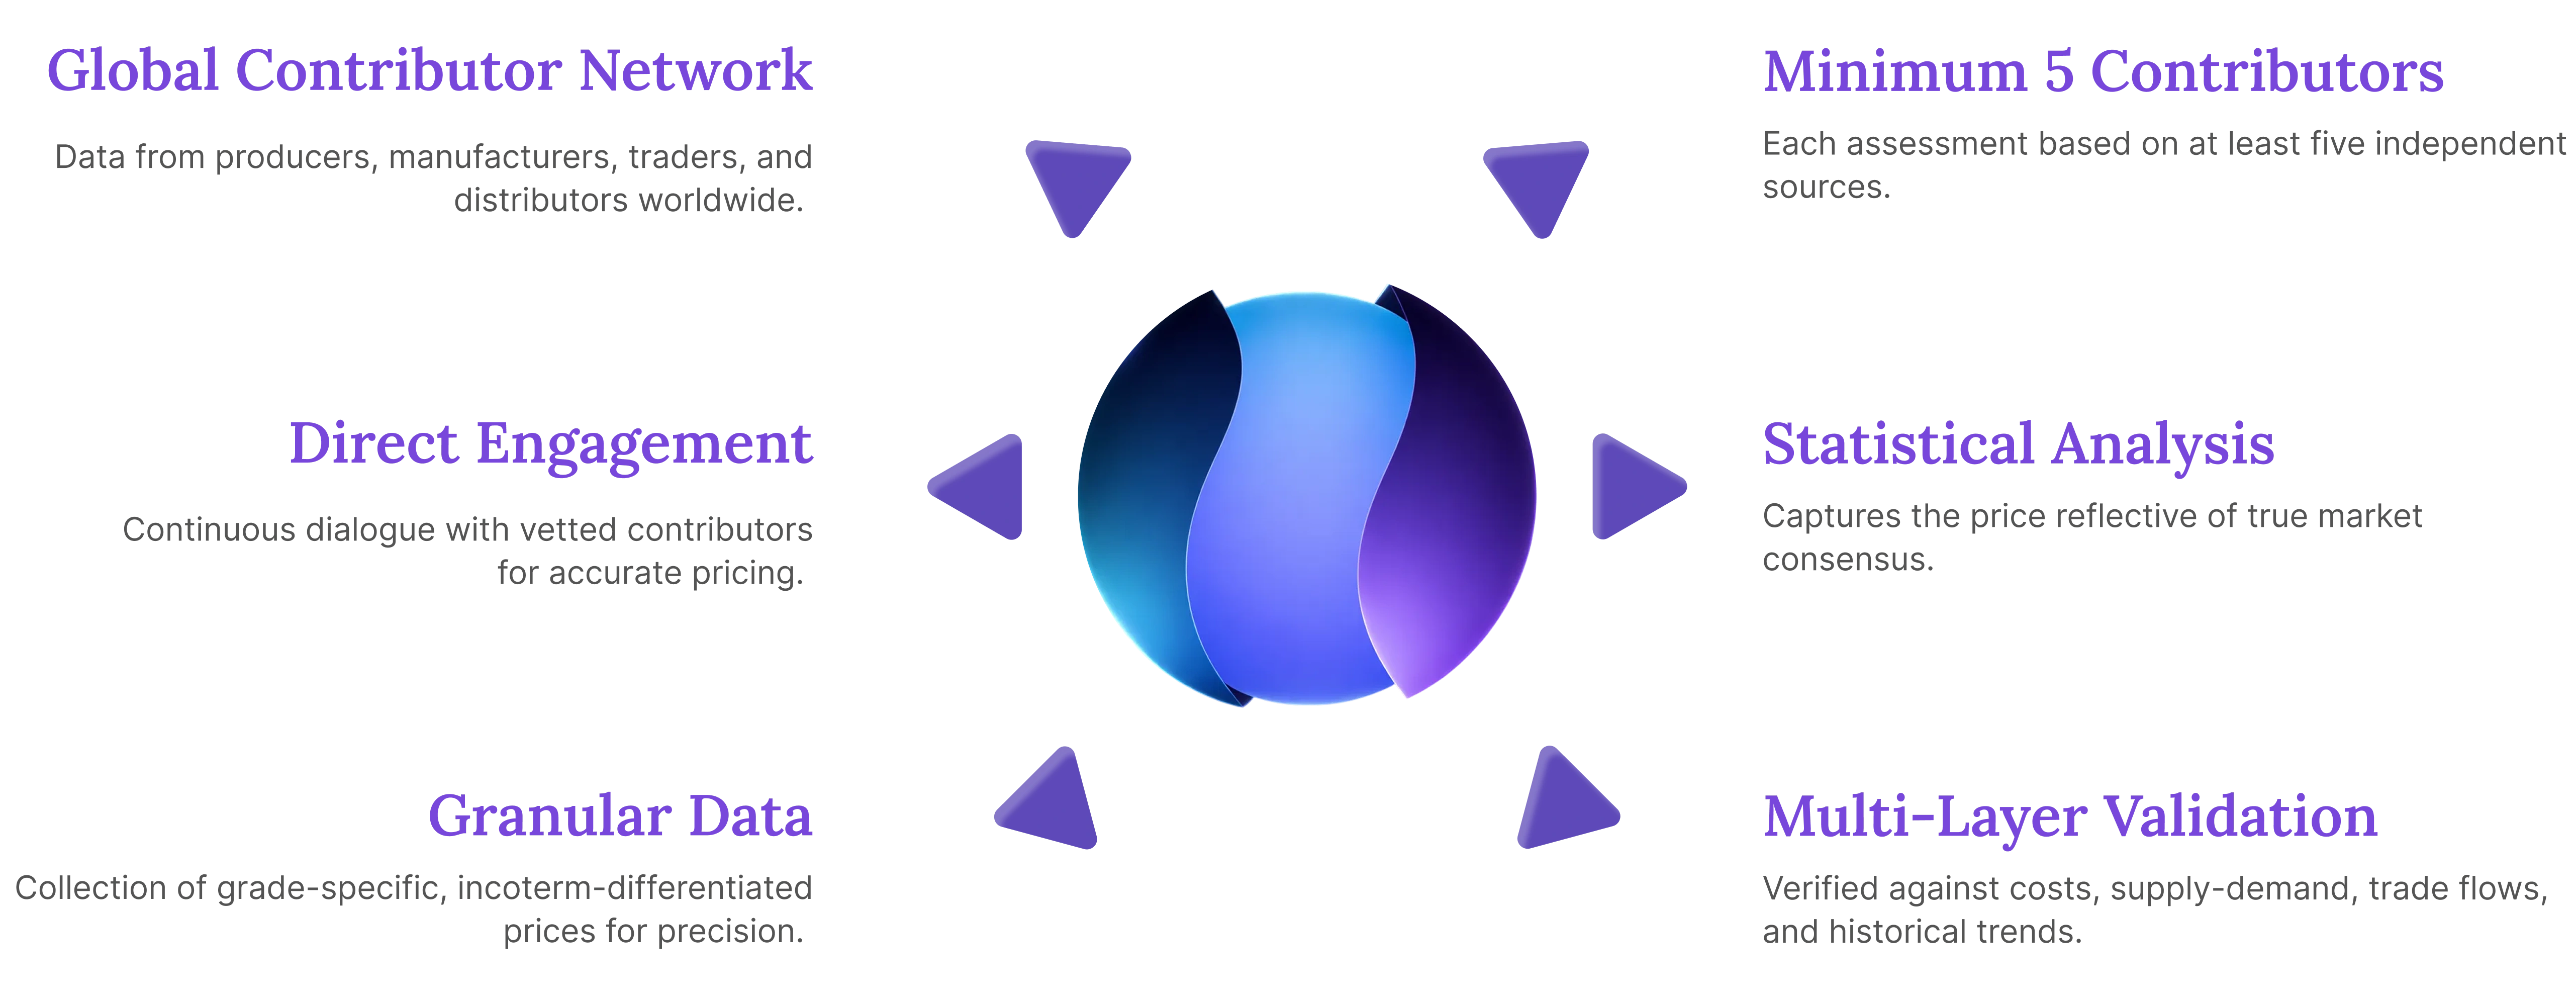
The displayed pricing data is derived through weighted average purchase price, including contract and spot transactions at the specified locations unless otherwise stated. The information provided comes from the compilation and processing of commercial data officially reported for each nation (i.e. government agencies, external trade bodies, and industry publications).
Our Price Analysis Methodology
Schedule A Demo
Experience how Procurement Resource transforms raw material price data into clear, decision ready intelligence. Optimise your performance with reliable, expert market data and analysis. Schedule your demo today to experience a live walk-through where our experts will showcase interactive price charts, forecasted prices, and insights driving the prices for your key commodities, tailored to your workflows. Contact us now!
Our Team will be happy to assist you
We are just a text away
Still Need Help ?
Europe & Africa
+44 7573 171117
Sales@prourementresource.com
USA & Canada
+1 307 363 1045
Sales@prourementresource.com
APAC
+91 8850629517
Sales@prourementresource.com
Subscription Plans
Unlock full access to Procurement Resource's price databases, interactive charts, and short-term forecasts for thousands of commodities. Elevate your sourcing decisions by comparing prices across regions, downloading historical data, and layering in analyst-backed insights, all with our flexible plans that scale as your portfolio grows.
Still have any Questions
Contact Us


Price Trend Dashboard - What's Included
Price trends across a diverse portfolio of categories amd products, spanning board to niche chemicas
Coverage extendable to grade-specific chemicals based on procurement requirements
Regular price tracking supported by robust historical datasets
News, policy updates, and key market drivers impacting price movements
Short-term and long-term price outlooks and forecasts
Supply–demand dynamics and capacity-driven market analysis
- Unlimited Users
- Historical Monthly Price
- USA, Europe, APAC Covered
- Monthly Forecast
- 12 Months validity
- News & Events
- 50 Products (Refer Next Page For List)
Why Procurement Database

Assistance from Experts
Throughout 2024, the Asian acetoin market experienced fluctuating trends with regional variations. Q1 began with moderate price increases driven by supply constraints from Chang Chun Plastics' maintenance shutdown in Taiwan. Post-S...

Client's Satisfaction
Throughout 2024, the Asian acetoin market experienced fluctuating trends with regional variations. Q1 began with moderate price increases driven by supply constraints from Chang Chun Plastics' maintenance shutdown in Taiwan. Post-S...

Assured Collaboration
Throughout 2024, the Asian acetoin market experienced fluctuating trends with regional variations. Q1 began with moderate price increases driven by supply constraints from Chang Chun Plastics' maintenance shutdown in Taiwan. Post-S...
Global Insights
Throughout 2024, the Asian acetoin market experienced fluctuating trends with regional variations. Q1 began with moderate price increases driven by supply constraints from Chang Chun Plastics' maintenance shutdown in Taiwan. Post-S...
1/4