Coal Tar Price Trend and Forecast
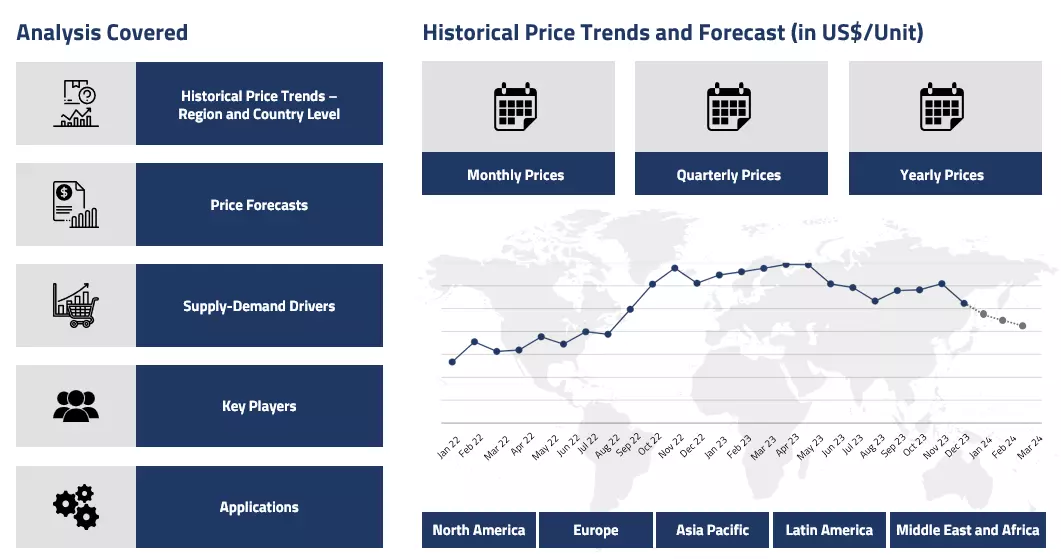
Coal Tar Regional Price Overview
Get the latest insights on price movement and trend analysis of Coal Tar in different regions across the world (Asia, Europe, North America, Latin America, and the Middle East & Africa).
Coal Tar Price Trend for the Second Half of 2024
The coal tar market in H2’24 experienced significant volatility driven by shifting industrial dynamics and energy transitions. Chemical and industrial sectors remained key consumers, though demand showed signs of moderation. The market was heavily influenced by steel production trends in major economies like China and India, which saw slight declines in production during this period.
Coal Tar Price Chart
Please Login or Subscribe to Access the Coal Tar Price Chart Data
Regional petrochemical and manufacturing sectors continued to utilize coal tar in various applications, including road construction, chemical synthesis, and specialized industrial processes. The market faced pressure from environmental regulations and increasing shifts towards more sustainable alternatives. Steel industry fluctuations directly impacted coal tar production, as it is a byproduct of metallurgical processes.
Asian markets, particularly China and India, remained crucial in determining global coal tar dynamics. The market saw intermittent price fluctuations, with manufacturers adapting to changing industrial demands and environmental constraints. Downstream industries like carbon black production and chemical manufacturing continued to be primary consumers.
Analyst Insight
According to Procurement Resource, the Coal Tar market will undergo continued market transformation, with increasing pressure from green technologies and alternative materials potentially reshaping coal tar's industrial positioning.
Coal Tar Price Trend for the First Half of 2024
Coal tar is a thick, dark liquid that is a byproduct of the carbonization of coal, a process used to produce coke and coal gas from coal. It is composed of a complex mixture of hydrocarbons, phenols, and other organic compounds. Coal tar is produced when coal is heated in the absence of air via pyrolysis. Coal tar prices fell during the first half of 2024 primarily due to the decline in global coal demand and the resultant drop in thermal coal prices. As major coal-consuming countries like China and India significantly increased their domestic coal production, the reliance on imports diminished, leading to an oversupply in the global market.
This oversupply, coupled with weakening demand, particularly in Europe, where the shift towards alternative energy sources and increased gas storage reduced coal usage, exerted downward pressure on coal prices. Since coal tar is a byproduct of the coal industry, its prices are closely tied to coal market dynamics. The decline in coal prices, driven by these global supply-demand imbalances and reduced industrial activity, naturally led to a corresponding decrease in coal tar prices during this period.
Analyst Insight
According to Procurement Resource, no relief is in sight for the Coal Tar prices going forward since the markets will remain impacted by the oversupply and excess inventory stock in the coming months.
Coal Tar Price Trend for the Second Half of 2023
Since coal tar is a resultant material of the pyrolysis of coal, coal tar prices closely follow the price trajectory of its feedstock material, coal. The market began on a humble note at the beginning of the third quarter, as the inventories were still able to support the downstream demands subtly. However, as the fuel prices started rising and along rose the coal prices, the coal tar prices also started to incline.
Along with the raw material costs the production prices also surged because of the increase in process charges. The downstream demands were also largely supportive of these market prices. Overall, a rising price trend was witnessed in H2’23.
Analyst Insight
According to Procurement Resource, the Coal Tar price trend is expected to continue in a similar manner for some time. However, it is likely to strive for stability in the long run.
Coal Tar Price Trend for the First Half of 2023
Coal Tar is obtained by pyrolysis of coal, so the price trend of Coal Tar are closely dependent on the feedstock coal prices. Coal Tar is a product used in downstream processes in various industries, like in road construction for binding, in dyes, paints, pharma, pesticide, and cosmetic sectors.
In the first half of the year 2023, the market felt a little constricted, and consumer sentiments were also observed to be muted. Coal mining practices have always faced ethical questions, but the availability was still in surplus. It was the feeble demands from downstream sectors that affected the Coal Tar market as the industries were trying to switch to greener and sustainable ways. Overall, the Coal Tar market was observed to be bearish.
Analyst Insight
According to Procurement Resource, Coal Tar prices are likely to dip further given the feeble demands and overflowing inventories.
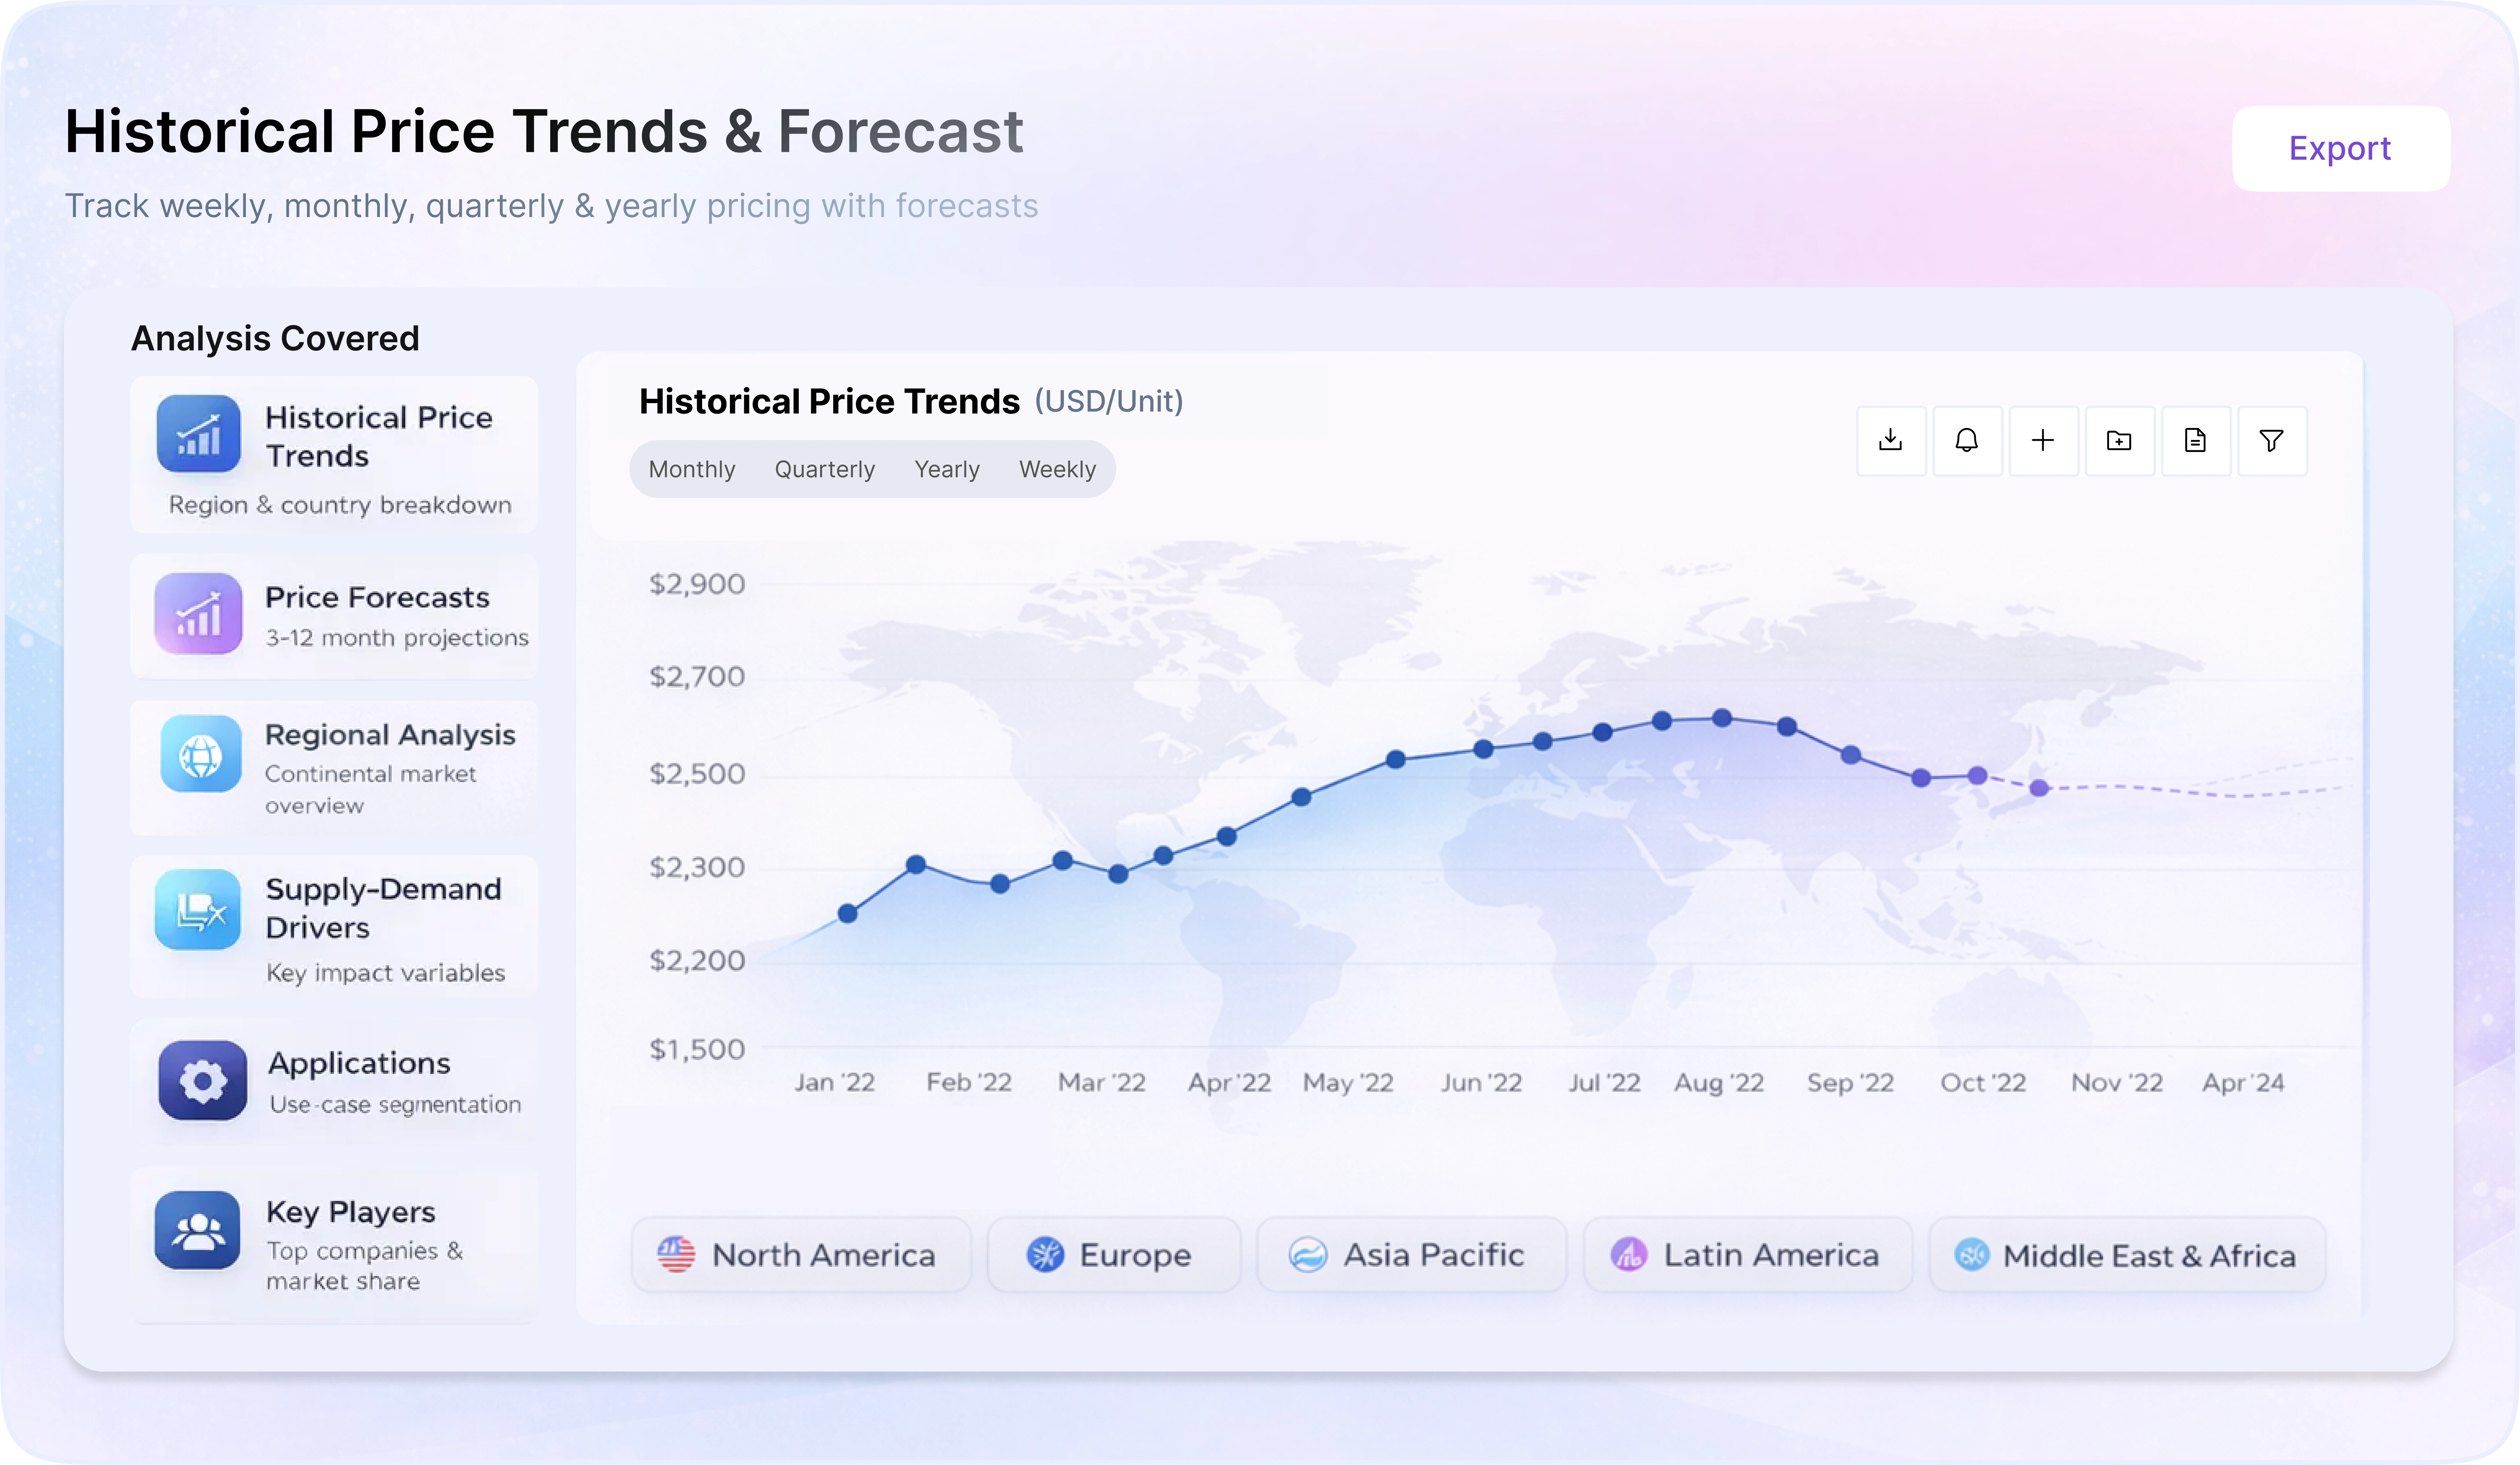
Procurement Resource provides latest prices of Coal Tar. Each price database is tied to a user-friendly graphing tool dating back to 2014, which provides a range of functionalities: configuration of price series over user defined time period; comparison of product movements across countries; customisation of price currencies and unit; extraction of price data as excel files to be used offline.
Our Clients


Procurement Resource Database
Turn price intelligence into action with the Procurement Resource Database. Log in or subscribe to unlock live price trends, historical charts, supplier databases, cost curves, and analyst-backed insights across chemicals, agriculture, energy, packaging, and more. Use these tools to benchmark your contracts, plan budgets with confidence, and stay ahead of market moves on every product you buy.
Coal Tar Dashboard Inclusions
0
+Products
0
+Regions
0
+Subscriptions
About Coal Tar
Coal tar is a thick black liquid formed due to heating the coal in the absence of air. It is a mixture of hydrocarbon compounds used in medications, road paving, rubber production, coking and smelting etc.
Coal Tar Product Details
| Report Features | Details |
| Product Name | Coal tar |
| Industrial Uses | Paints, perfumes, synthetic dyes, photographic material, drugs, explosives, insecticides, pesticides, cosmetics, ointments |
| Chemical Formula | C14H18O4CLN5 |
| HS Number | 27060010 |
| CAS Number | 65996-92-1 |
| Synonyms | Pitchtar, Fluxol ST, Pyrolized pitch |
| Molecular Weight | 230 to 3213 g/mol |
| Supplier Database | JFE, Koppers Industries, etc., RuTGERS, Baoshun |
| Region/Countries Covered | Asia Pacific: China, India, Indonesia, Pakistan, Bangladesh, Japan, Philippines, Vietnam, Iran, Thailand, South Korea, Iraq, Saudi Arabia, Malaysia, Nepal, Taiwan, Sri Lanka, UAE, Israel, Hongkong, Singapore, Oman, Kuwait, Qatar, Australia, and New Zealand Europe: Germany, France, United Kingdom, Italy, Spain, Russia, Turkey, Netherlands, Poland, Sweden, Belgium, Austria, Ireland Switzerland, Norway, Denmark, Romania, Finland, Czech Republic, Portugal and Greece North America: United States and Canada Latin America: Brazil, Mexico, Argentina, Columbia, Chile, Ecuador, and Peru Africa: South Africa, Nigeria, Egypt, Algeria, Morocco |
| Currency | US$ (Data can also be provided in local currency) |
| Supplier Database Availability | Yes |
| Customization Scope | The report can be customized as per the requirements of the customer |
| Post-Sale Analyst Support | 360-degree analyst support after report delivery |
Note: Our supplier search experts can assist your procurement teams in compiling and validating a list of suppliers indicating they have products, services, and capabilities that meet your company's needs.
Coal Tar Production Processes
Coal tar is produced as a byproduct of the carbonization or pyrolysis of coal in which the coal is heated in the absence of air. Coal tar is obtained while cooling the gas formed during the destructive distillation of coal.
Methodology
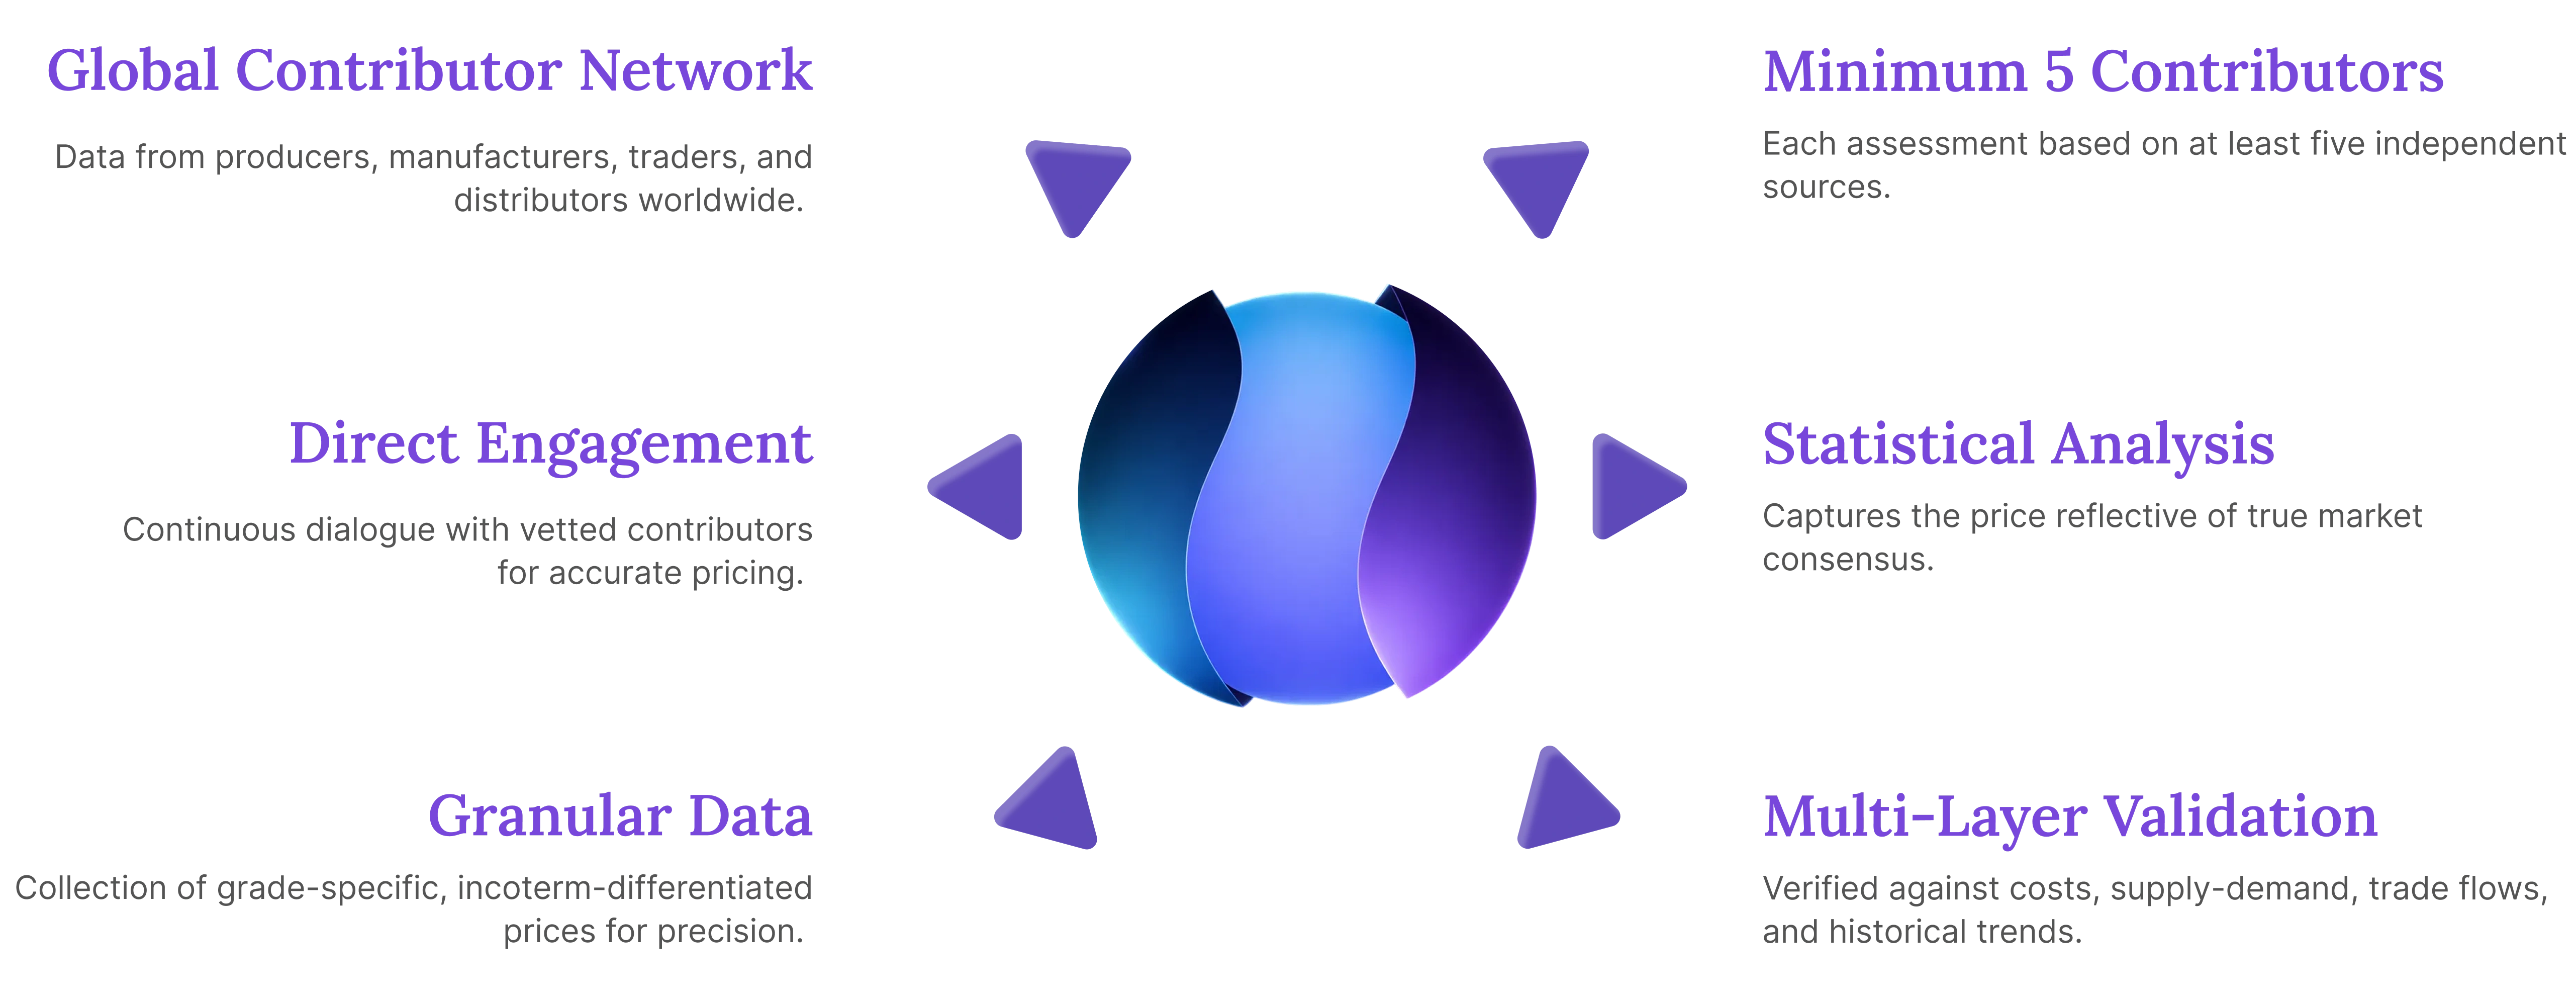
The displayed pricing data is derived through weighted average purchase price, including contract and spot transactions at the specified locations unless otherwise stated. The information provided comes from the compilation and processing of commercial data officially reported for each nation (i.e. government agencies, external trade bodies, and industry publications).
Our Price Analysis Methodology

Schedule A Demo
Experience how Procurement Resource transforms raw material price data into clear, decision ready intelligence. Optimise your performance with reliable, expert market data and analysis. Schedule your demo today to experience a live walk-through where our experts will showcase interactive price charts, forecasted prices, and insights driving the prices for your key commodities, tailored to your workflows. Contact us now!
Our Team will be happy to assist you
We are just a text away
Still Need Help ?
Europe & Africa
+44 7573 171117
Sales@prourementresource.com
USA & Canada
+1 307 363 1045
Sales@prourementresource.com
APAC
+91 8850629517
Sales@prourementresource.com
Subscription Plans
Unlock full access to Procurement Resource's price databases, interactive charts, and short-term forecasts for thousands of commodities. Elevate your sourcing decisions by comparing prices across regions, downloading historical data, and layering in analyst-backed insights, all with our flexible plans that scale as your portfolio grows.
Still have any Questions
Contact Us


Price Trend Dashboard - What's Included
Price trends across a diverse portfolio of categories amd products, spanning board to niche chemicas
Coverage extendable to grade-specific chemicals based on procurement requirements
Regular price tracking supported by robust historical datasets
News, policy updates, and key market drivers impacting price movements
Short-term and long-term price outlooks and forecasts
Supply–demand dynamics and capacity-driven market analysis
- Unlimited Users
- Historical Monthly Price
- USA, Europe, APAC Covered
- Monthly Forecast
- 12 Months validity
- News & Events
- 50 Products (Refer Next Page For List)
Why Procurement Database

Assistance from Experts
Throughout 2024, the Asian acetoin market experienced fluctuating trends with regional variations. Q1 began with moderate price increases driven by supply constraints from Chang Chun Plastics' maintenance shutdown in Taiwan. Post-S...

Client's Satisfaction
Throughout 2024, the Asian acetoin market experienced fluctuating trends with regional variations. Q1 began with moderate price increases driven by supply constraints from Chang Chun Plastics' maintenance shutdown in Taiwan. Post-S...

Assured Collaboration
Throughout 2024, the Asian acetoin market experienced fluctuating trends with regional variations. Q1 began with moderate price increases driven by supply constraints from Chang Chun Plastics' maintenance shutdown in Taiwan. Post-S...
Global Insights
Throughout 2024, the Asian acetoin market experienced fluctuating trends with regional variations. Q1 began with moderate price increases driven by supply constraints from Chang Chun Plastics' maintenance shutdown in Taiwan. Post-S...
1/4