Coconut Price Trend and Forecast
Coconut Regional Price Overview
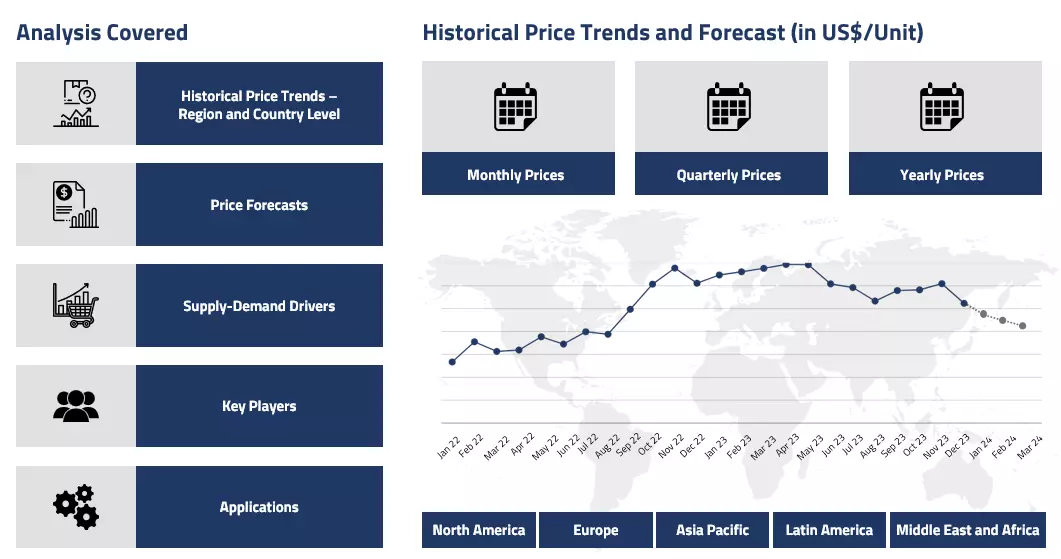
Get the latest insights on price movement and trend analysis of Coconut in different regions across the world (Asia, Europe, North America, Latin America, and the Middle East & Africa).
Coconut Price Trend for the Second Half of 2024
| Product | Category | Region | Price | Time Period |
| Coconut | Agriculture, Farming and Commodity | Malaysia | 740 USD/MT | July'24 |
| Coconut | Agriculture, Farming and Commodity | Malaysia | 860 USD/MT | December'24 |
| Coconut | Agriculture, Farming and Commodity | Indonesia | 705 USD/MT | July'24 |
| Coconut | Agriculture, Farming and Commodity | Indonesia | 810 USD/MT | December'24 |
Stay updated with the latest Coconut prices, historical data, and tailored regional analysis
The coconut price graph showed upward movements throughout the second half of 2024. Market trends were heavily influenced by producers in Indonesia and Malaysia. In Indonesia, coconut prices increased from around 705 USD/MT (EXW) in July to approximately 810 USD/MT in December. This price rise occurred as Indonesia shifted its focus to palm oil exports, reducing resources allocated to coconut production. Similarly, in Malaysia, prices rose from around 740 USD/MT (CIF) in July to about 860 USD/MT in December. Malaysia ramped up its palm oil production to meet growing export demand, which led to a decrease in coconut production.
Coconut Price Chart
Please Login or Subscribe to Access the Coconut Price Chart Data
The imposition of higher import duties on edible oils such as palm, sunflower, and soybean by the Indian government further contributed to rising demand for coconut oil, as buyers sought alternatives. Copra and fresh coconuts gained popularity due to this shift. Additionally, large shipments of coconuts to northern states for festivals like Navratri led to supply shortages in southern India, further straining the market.
Analyst Insight
According to Procurement Resource, the coconut prices are expected to normalise in the upcoming months after remaining bullish in the last months of 2024 as governments adopt measures to tackle the soaring prices in various regions.
Coconut Price Trend for the First Half of 2024
| Product | Category | Region | Price | Time Period |
| Coconut | Agriculture, Farming and Commodity | Malaysia | 676 USD/MT | January'24 |
| Coconut | Agriculture, Farming and Commodity | Malaysia | 756 USD/MT | June’24 |
| Coconut | Agriculture, Farming and Commodity | Indonesia | 641 USD/MT | January'24 |
| Coconut | Agriculture, Farming and Commodity | Indonesia | 720 USD/MT | June’24 |
Stay updated with the latest Coconut prices, historical data, and tailored regional analysis
Demand for organic coconuts and other materials from Southeast Asia is rising due to fears of severe weather events in 2024. In the discussed two quarters, demand for Southeast Asian-imported coconut ingredients increased, driven by concerns over an El Nino season. This has particularly affected coconut commodities from the Philippines and Sri Lanka. Songkran Festival holiday in Thailand also pushed the demand for coconut. In the Indian markets, the strong heatwaves stirred up end consumer demands for coconut further strengthening the market prices in the continent.
In the Malaysian market, the monthly average prices went from about 676 USD/MT (CIF) in January to around 756 USD/MT (CIF) in June’24. Similarly, in the Indonesian markets, the monthly average prices went from about 641 USD/MT (EXW) in January’24 to approximately 720 USD/MT in June’24. Prices were more stable in domestic Indonesian and Philippines markets in the second quarter as the supply and demand equation was more balanced domestically. Incurring supplies were able to cater to the rising demands. Overall, a largely positive market trajectory was observed for coconuts during the said time period.
Analyst Insight
According to Procurement Resource, the demand outlook is expected to remain elevated for coconuts in the ongoing summer season going forward as well. Therefore, the market projection is optimistic.
Coconut Price Index for the Q1 of 2024
| Product | Category | Region | Price | Time Period |
| Coconut | Agriculture, Farming and Commodity | Malaysia | 698 USD/MT | March 2024 |
| Coconut | Agriculture, Farming and Commodity | Indonesia | 678 USD/MT | March 2024 |
| Coconut | Agriculture, Farming and Commodity | Philippines | 646 USD/MT | March 2024 |
Stay updated with the latest Coconut prices, historical data, and tailored regional analysis
Coconut Price Trend for the Second Half of 2023
| Product | Category | Region | Price | Time Period |
| Coconut | Agriculture, Farming and Commodity | Indonesia | 600 USD/MT | July 2023 |
| Coconut | Agriculture, Farming and Commodity | Indonesia | 645 USD/MT | December 2023 |
| Coconut | Agriculture, Farming and Commodity | Malaysia | 645 USD/MT | July 2023 |
| Coconut | Agriculture, Farming and Commodity | Malaysia | 680 USD/MT | December 2023 |
Stay updated with the latest Coconut prices, historical data, and tailored regional analysis
The coconut prices were observed to be fluctuating within a narrow range during the said period of the year 2023. In the Indonesian market, the monthly average prices for coconut went from around 600 USD/MT (Indonesia, EXW) in July to about 645 USD/MT in December’23. Similarly, in the Malaysian market, the monthly average prices (Malaysia, CIF) went from around 645 USD/MT (Malaysia, CIF) in July to about 680 USD/MT in December’23.
The general market sentiments were largely positive despite some reverse fluctuations during the time of quarter change. To support the robustness of the Indian coconut market, the Government of India approved a 2.7% rise in the MSP of milling copra and a 2% rise in the ball copra. These initiatives are supporting the projections of the coconut market in the coming months. Overall, positive market sentiments were witnessed.
Analyst Insight
According to Procurement Resource, the Coconut price trends are expected to rise going forward, given the current supportive supply and demand dynamics.
Coconut Price Trend for the First Half of 2023
In India, the production of coconut took a downward trend in the first two quarters of 2023, which affected its market availability. The rates of exports, however, grew by almost 10%, which further depleted the inventory levels. However, the export routes were disrupted by feeble cargo movement and the reluctance of shipping lines to deliver the product to Russia, which, along with Ukraine, forms almost 75 percent of the export volumes of coconut from India.
Thus, the result of low production and high demand from both domestic and international markets positively affected the growth of coconut prices, especially in the first quarter. The rise in the prices of coconut in some of the regions was by almost 50%. The trend, however, slowed down towards the end months of the second quarter after the market reached its saturation point.
Analyst Insight
According to Procurement Resource, the price of Coconut is expected to oscillate with the availability of the product in the markets and its demand.
Procurement Resource provides latest prices of Coconut. Each price database is tied to a user-friendly graphing tool dating back to 2014, which provides a range of functionalities: configuration of price series over user defined time period; comparison of product movements across countries; customisation of price currencies and unit; extraction of price data as excel files to be used offline.
Our Clients


Procurement Resource Database
Turn price intelligence into action with the Procurement Resource Database. Log in or subscribe to unlock live price trends, historical charts, supplier databases, cost curves, and analyst-backed insights across chemicals, agriculture, energy, packaging, and more. Use these tools to benchmark your contracts, plan budgets with confidence, and stay ahead of market moves on every product you buy.
Coconut Dashboard Inclusions
0
+Products
0
+Regions
0
+Subscriptions
About Coconut
Coconut belongs to the family Arecaceae (palm family). The coconut fruit is a drupe comprising a fibrous husk, a hard shell, and white, edible endosperm with coconut water inside. Coconuts are widely cultivated in tropical regions and are used for various purposes, including food, beverages, cosmetics, and industrial applications.
Coconut Product Details
| Report Features | Details |
| Product Name | Coconut |
| Supplier Database | Edward and Sons Trading Company, Mahavir Coconut Industries (MaxCare), Greenville Agro, Hain Celestial Group, Barlean’s Organic Oils LLC, Nutiva, Inc |
| HS Code | 08011200 |
| Synonyms | Cocos nucifera (scientific name) |
| Industrial Uses | Food and beverage (coconut oil, milk, water, desiccated coconut, flour, sugar), cosmetics and personal care (skincare, hair care, soaps, lotions, lip balms), pharmaceutical and healthcare (dietary supplements, herbal remedies), biofuel production (biodiesel, industrial lubricants, machinery lubricants), textile (ropes, mats, carpets), construction and building materials (coconut timber). |
| Region/Countries Covered | Asia Pacific: China, India, Indonesia, Pakistan, Bangladesh, Japan, Philippines, Vietnam, Iran, Thailand, South Korea, Iraq, Saudi Arabia, Malaysia, Nepal, Taiwan, Sri Lanka, UAE, Israel, Hongkong, Singapore, Oman, Kuwait, Qatar, Australia, and New Zealand Europe: Germany, France, United Kingdom, Italy, Spain, Russia, Turkey, Netherlands, Poland, Sweden, Belgium, Austria, Ireland Switzerland, Norway, Denmark, Romania, Finland, Czech Republic, Portugal and Greece North America: United States and Canada Latin America: Brazil, Mexico, Argentina, Columbia, Chile, Ecuador, and Peru Africa: South Africa, Nigeria, Egypt, Algeria, Morocco |
| Currency | US$ (Data can also be provided in local currency) |
| Supplier Database Availability | Yes |
| Customization Scope | The report can be customized as per the requirements of the customer |
| Post-Sale Analyst Support | 360-degree analyst support after report delivery |
Note: Our supplier search experts can assist your procurement teams in compiling and validating a list of suppliers indicating they have products, services, and capabilities that meet your company's needs.
Methodology
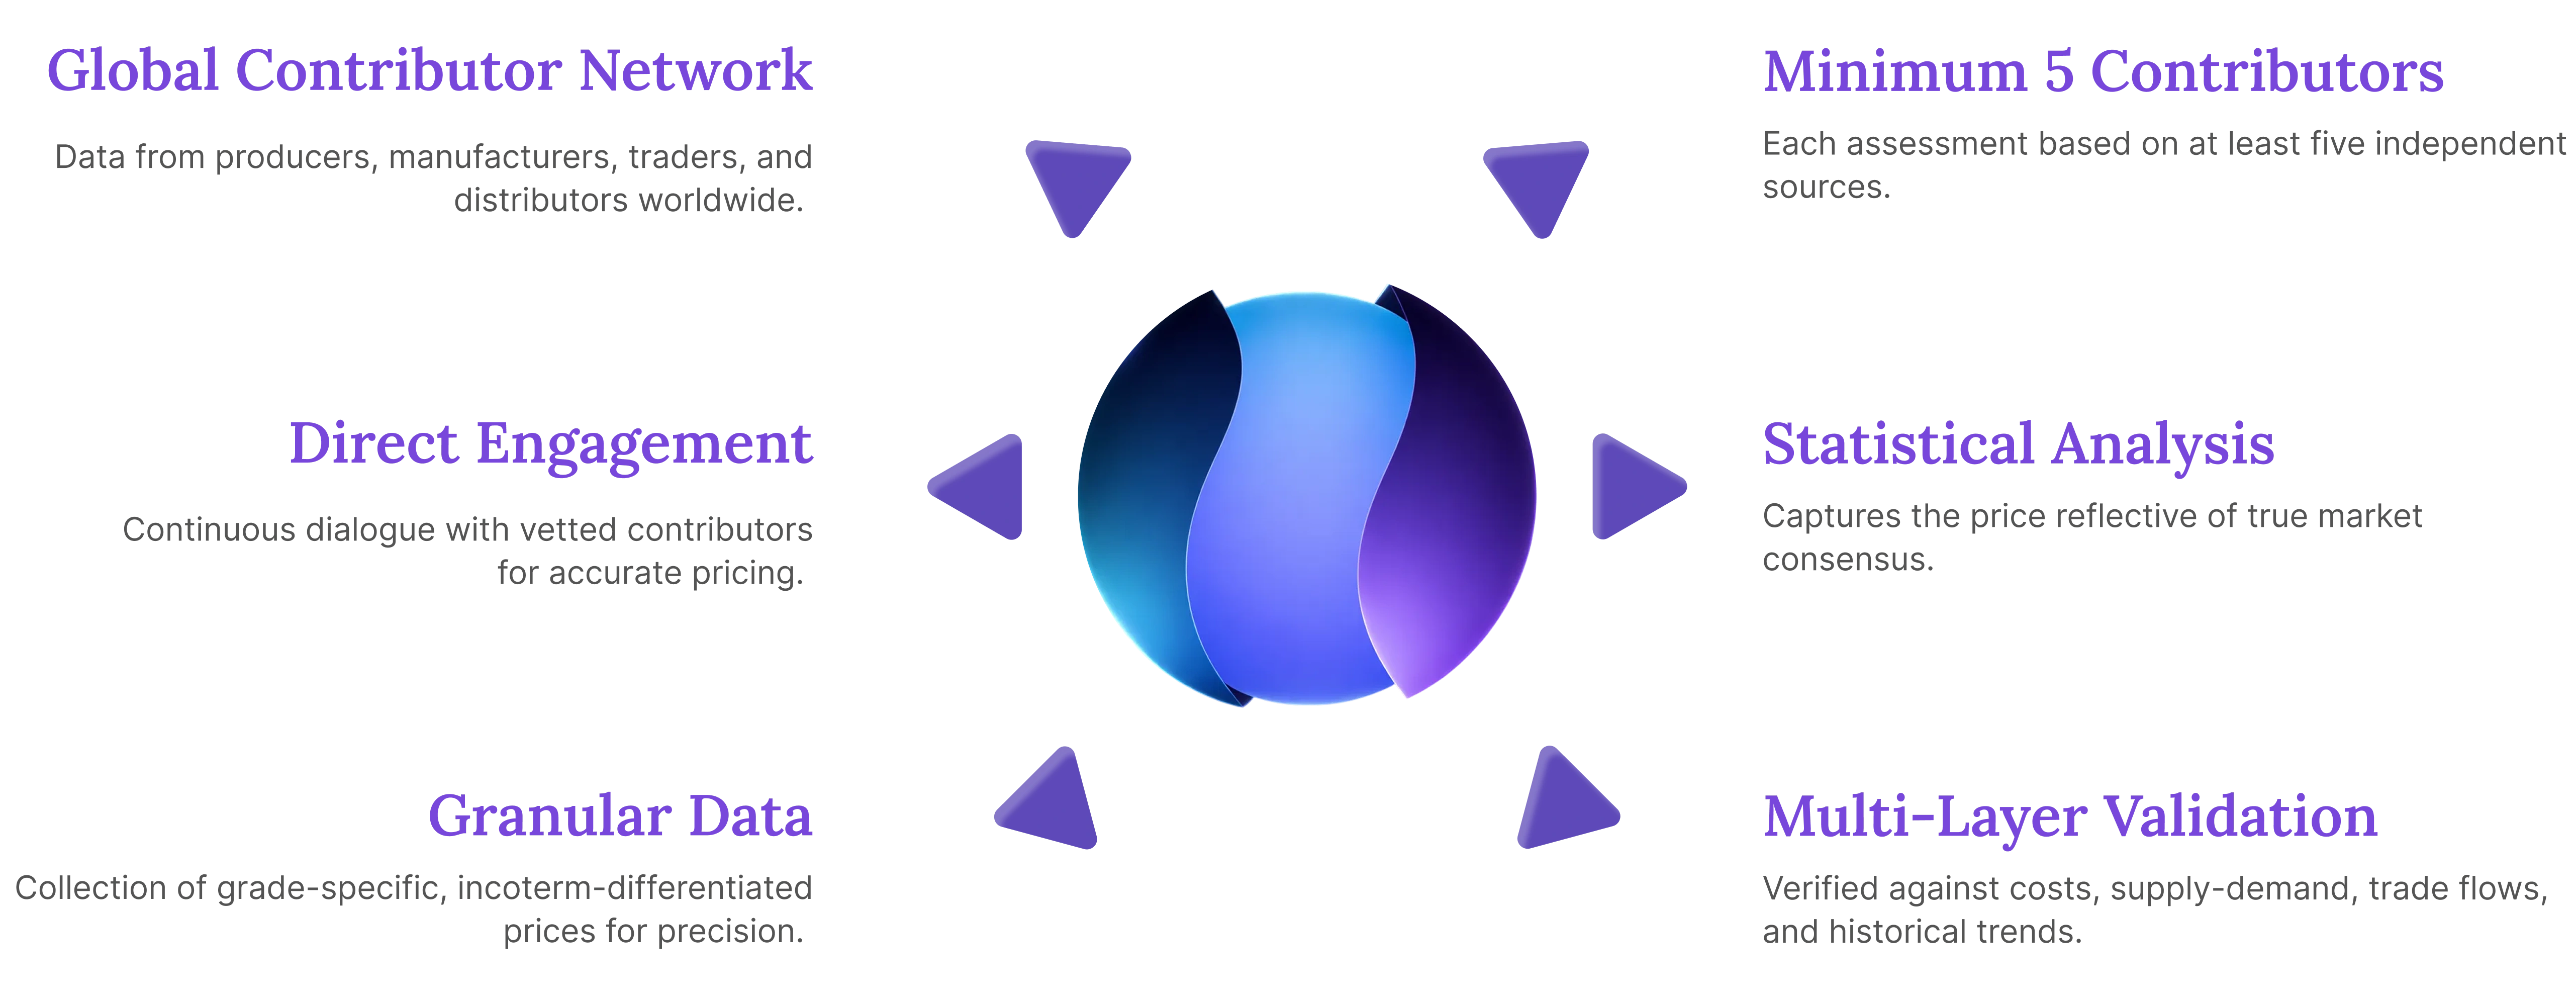
The displayed pricing data is derived through weighted average purchase price, including contract and spot transactions at the specified locations unless otherwise stated. The information provided comes from the compilation and processing of commercial data officially reported for each nation (i.e. government agencies, external trade bodies, and industry publications).
Our Price Analysis Methodology
Schedule A Demo
Experience how Procurement Resource transforms raw material price data into clear, decision ready intelligence. Optimise your performance with reliable, expert market data and analysis. Schedule your demo today to experience a live walk-through where our experts will showcase interactive price charts, forecasted prices, and insights driving the prices for your key commodities, tailored to your workflows. Contact us now!
Our Team will be happy to assist you
We are just a text away
Still Need Help ?
Europe & Africa
+44 7573 171117
Sales@prourementresource.com
USA & Canada
+1 307 363 1045
Sales@prourementresource.com
APAC
+91 8850629517
Sales@prourementresource.com
Other Related Reports
Fatty Acid C12 Production from Coconut Oil
The study offers a detailed cost analysis of Fatty Acid C12 Production from Coconut Oil. In addition, the report incorporates the manufacturing process with detailed process and material flow, operating costs along with financial expenses and depreciation charges.
Crude Coconut Oil Production of Using Dry Method
The study offers a detailed cost analysis of Crude Coconut Oil Production of Using Dry Method. In addition, the report incorporates the manufacturing process with detailed process and material flow, operating costs along with financial expenses and depreciation charges.
Subscription Plans
Unlock full access to Procurement Resource's price databases, interactive charts, and short-term forecasts for thousands of commodities. Elevate your sourcing decisions by comparing prices across regions, downloading historical data, and layering in analyst-backed insights, all with our flexible plans that scale as your portfolio grows.
Still have any Questions
Contact Us


Price Trend Dashboard - What's Included
Price trends across a diverse portfolio of categories amd products, spanning board to niche chemicas
Coverage extendable to grade-specific chemicals based on procurement requirements
Regular price tracking supported by robust historical datasets
News, policy updates, and key market drivers impacting price movements
Short-term and long-term price outlooks and forecasts
Supply–demand dynamics and capacity-driven market analysis
- Unlimited Users
- Historical Monthly Price
- USA, Europe, APAC Covered
- Monthly Forecast
- 12 Months validity
- News & Events
- 50 Products (Refer Next Page For List)
Related News
View All

Why Procurement Database

Assistance from Experts
Throughout 2024, the Asian acetoin market experienced fluctuating trends with regional variations. Q1 began with moderate price increases driven by supply constraints from Chang Chun Plastics' maintenance shutdown in Taiwan. Post-S...

Client's Satisfaction
Throughout 2024, the Asian acetoin market experienced fluctuating trends with regional variations. Q1 began with moderate price increases driven by supply constraints from Chang Chun Plastics' maintenance shutdown in Taiwan. Post-S...

Assured Collaboration
Throughout 2024, the Asian acetoin market experienced fluctuating trends with regional variations. Q1 began with moderate price increases driven by supply constraints from Chang Chun Plastics' maintenance shutdown in Taiwan. Post-S...
Global Insights
Throughout 2024, the Asian acetoin market experienced fluctuating trends with regional variations. Q1 began with moderate price increases driven by supply constraints from Chang Chun Plastics' maintenance shutdown in Taiwan. Post-S...
1/4