Depreciation Rates Price Trend and Forecast
Depreciation Rates Regional Price Overview
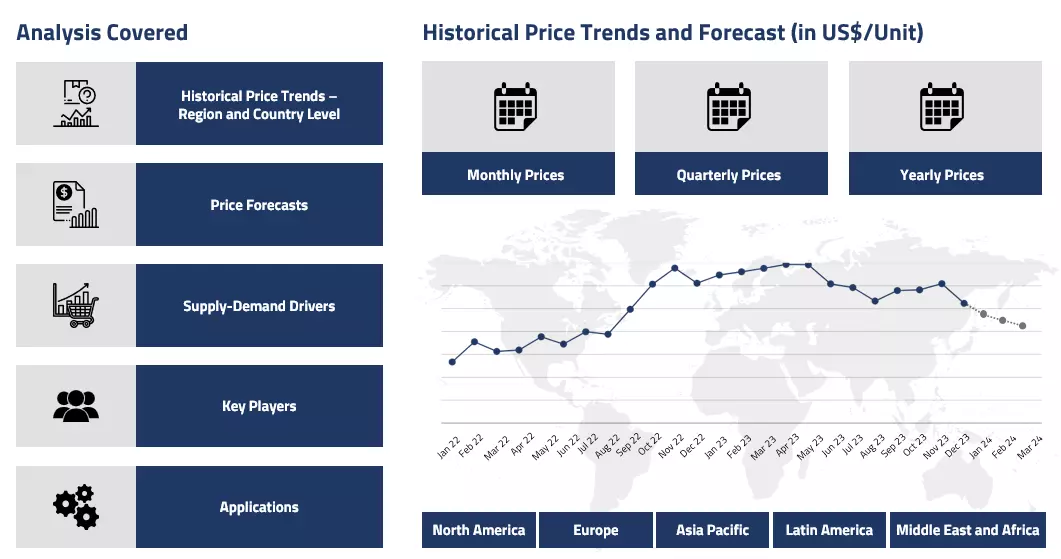
Get the latest insights on price movement and trend analysis of Depreciation Rates in different regions across the world (Asia, Europe, North America, Latin America, and the Middle East & Africa).
Depreciation Rates Price Trend for the Year 2023
Depreciation is used to waver the costs of an asset past its useful life. It is a compulsory reduction in the profit and loss statement of the owner of these depreciable assets. Various tangible (building, machinery, plant, or furniture) and intangible (patents, copyrights, trademarks, etc.) assets have been grouped under the depreciable block. For residential buildings, not including boarding houses and hotels, a 5% depreciation rate is assigned, while for hotels and boarding houses, a 10%, and for temporary constructions like wooden buildings, a 40% depreciation rate is assigned.
Depreciation Rates Price Chart
Please Login or Subscribe to Access the Depreciation Rates Price Chart Data
For furniture, a 10%; for plants and machinery, excluding motor vehicles, 15-30% depreciation, while for motor vehicles, a 30–45% depreciation depending on their purchase and age is assigned. For computers, proposal software, and other software, 40%, while for books in annual publications, a 100% depreciation is allowed. For intangible assets, a depreciation of up to 25% is allowed.
Depreciation Rates Price Trend for the Year 2022
Depreciation is defined as the reduction in the value of assets over time due wear and tear. As per the Income Tax Act for AY 2022-23, no depreciation will be allowed if an asset is acquired in cash more than 10,000 INR in a day. However, a depreciation claim can be filed if the amount is up to 10,000 INR a day. The government came out with the list of commodities and the depreciation allowance as the percentage of the written down cost.
The building used for residential purposes other than hotels incurs a total of 5% depreciation allowance, whereas machinery and production plants, if not specified otherwise, incur an allowance of 15%. Similarly, moulds used in the rubber and polymer industry incur a depreciation allowance of 30%, while the machinery required in garment processing industries incurs a depreciation allowance of 40%.
Depreciation rates have been significant all through a wide range of products as in temporary constructions (wood structures, furniture, aesthetic designs, etc.). The depreciation incurrence on this class of products have witnessed a significant 40 %. Along the similar lines, electrical fixtures along with fittings and different furniture saw a depreciation dip of around 10 %.
Aeroplanes and Aeroengines incurred a depreciation of 40 %. Moreover, equipment catering to air pollution control such as Felt filtering system, scrubbers, dust collection, etc. incurred a depreciation of 40 %.
Procurement Resource provides latest Depreciation Rates. Each price database is tied to a user-friendly graphing tool dating back to 2014, which provides a range of functionalities: configuration of price series over user defined time period; comparison of product movements across countries; customisation of price currencies and unit; extraction of price data as excel files to be used offline.
Our Clients


Procurement Resource Database
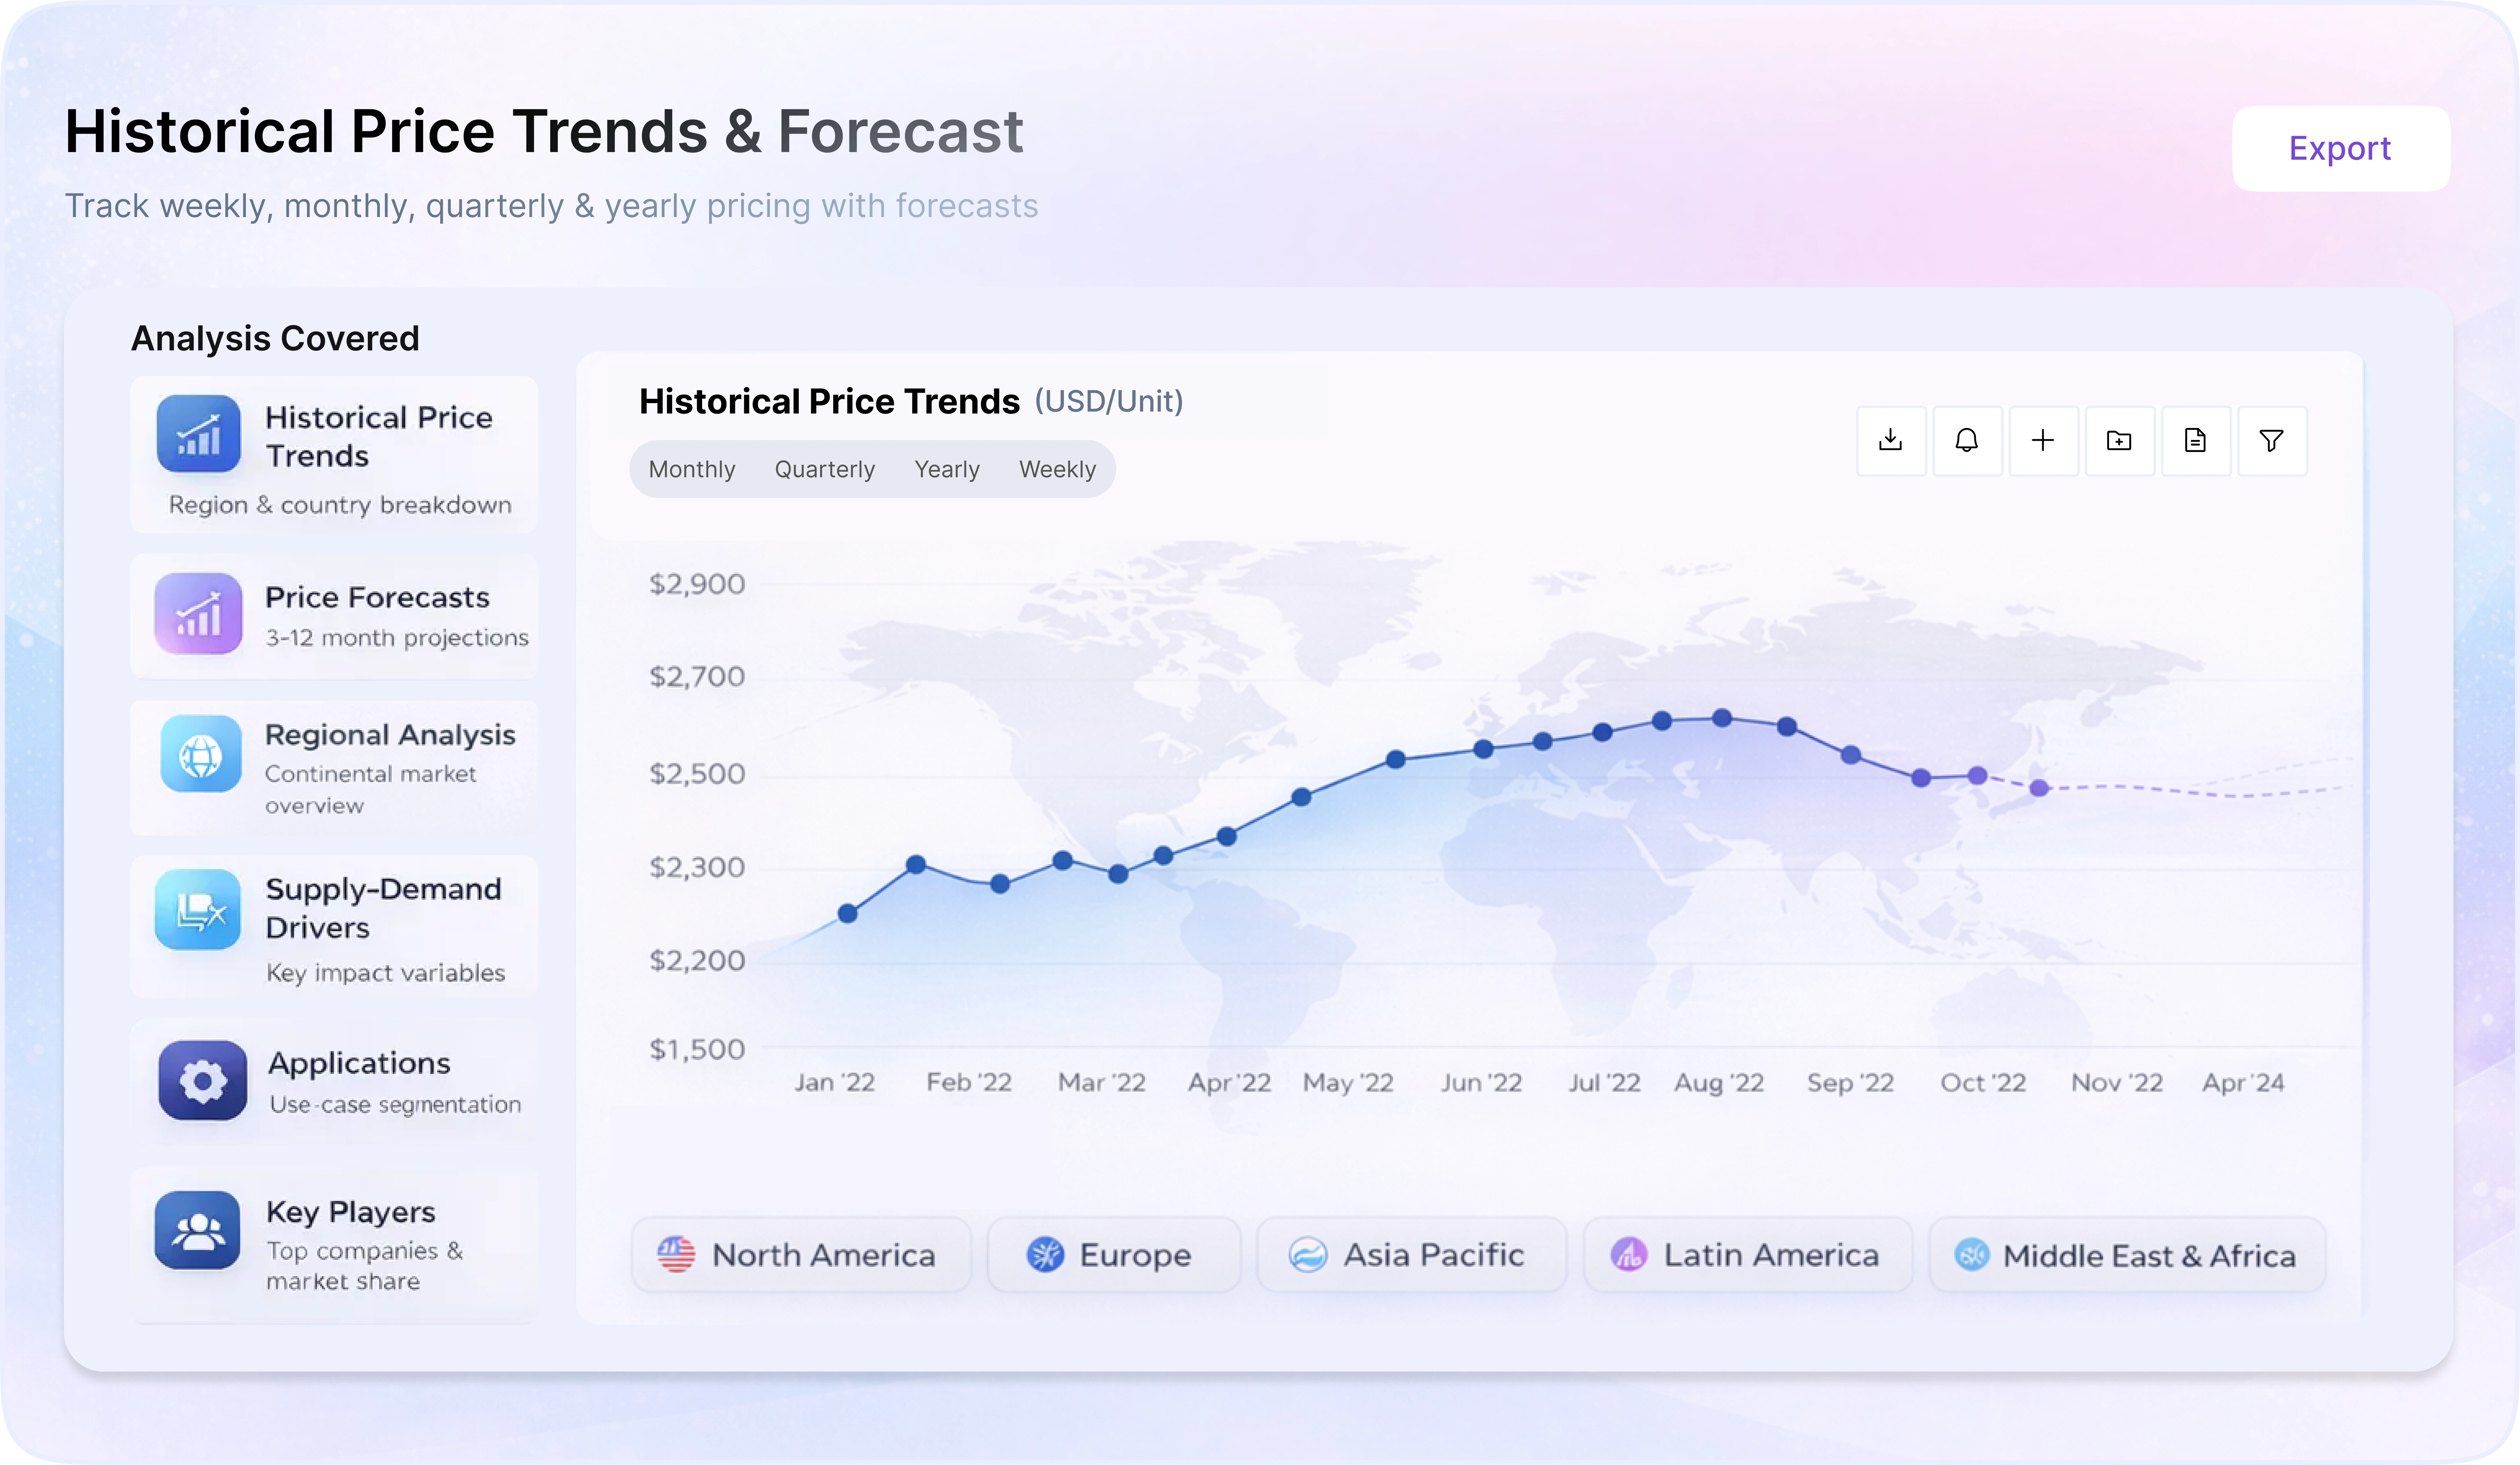
Turn price intelligence into action with the Procurement Resource Database. Log in or subscribe to unlock live price trends, historical charts, supplier databases, cost curves, and analyst-backed insights across chemicals, agriculture, energy, packaging, and more. Use these tools to benchmark your contracts, plan budgets with confidence, and stay ahead of market moves on every product you buy.
Depreciation Rates Dashboard Inclusions
0
+Products
0
+Regions
0
+Subscriptions
About Depreciation Rates
A depreciation rate refers to the percent rate at which an asset is depreciated or deflated across its estimated life. It may also be known as the percentage of a long-term investment done in an asset by a company, which the company can claim as tax-deductible expense across the useful life of the asset.
Depreciation Rates Product Details
| Report Features | Details |
| Product Name | Depreciation Rates |
| Region/Countries Covered | Asia Pacific: China, India, Indonesia, Pakistan, Bangladesh, Japan, Philippines, Vietnam, Iran, Thailand, South Korea, Iraq, Saudi Arabia, Malaysia, Nepal, Taiwan, Sri Lanka, UAE, Israel, Hongkong, Singapore, Oman, Kuwait, Qatar, Australia, and New Zealand Europe: Germany, France, United Kingdom, Italy, Spain, Russia, Turkey, Netherlands, Poland, Sweden, Belgium, Austria, Ireland Switzerland, Norway, Denmark, Romania, Finland, Czech Republic, Portugal and Greece North America: United States and Canada Latin America: Brazil, Mexico, Argentina, Columbia, Chile, Ecuador, and Peru Africa: South Africa, Nigeria, Egypt, Algeria, Morocco |
| Currency | US$ (Data can also be provided in local currency) |
| Supplier Database Availability | Yes |
| Customization Scope | The report can be customized as per the requirements of the customer |
| Post-Sale Analyst Support | 360-degree analyst support after report delivery |
Note: Our supplier search experts can assist your procurement teams in compiling and validating a list of suppliers indicating they have products, services, and capabilities that meet your company's needs.
Methodology
The displayed pricing data is derived through weighted average purchase price, including contract and spot transactions at the specified locations unless otherwise stated. The information provided comes from the compilation and processing of commercial data officially reported for each nation (i.e. government agencies, external trade bodies, and industry publications).
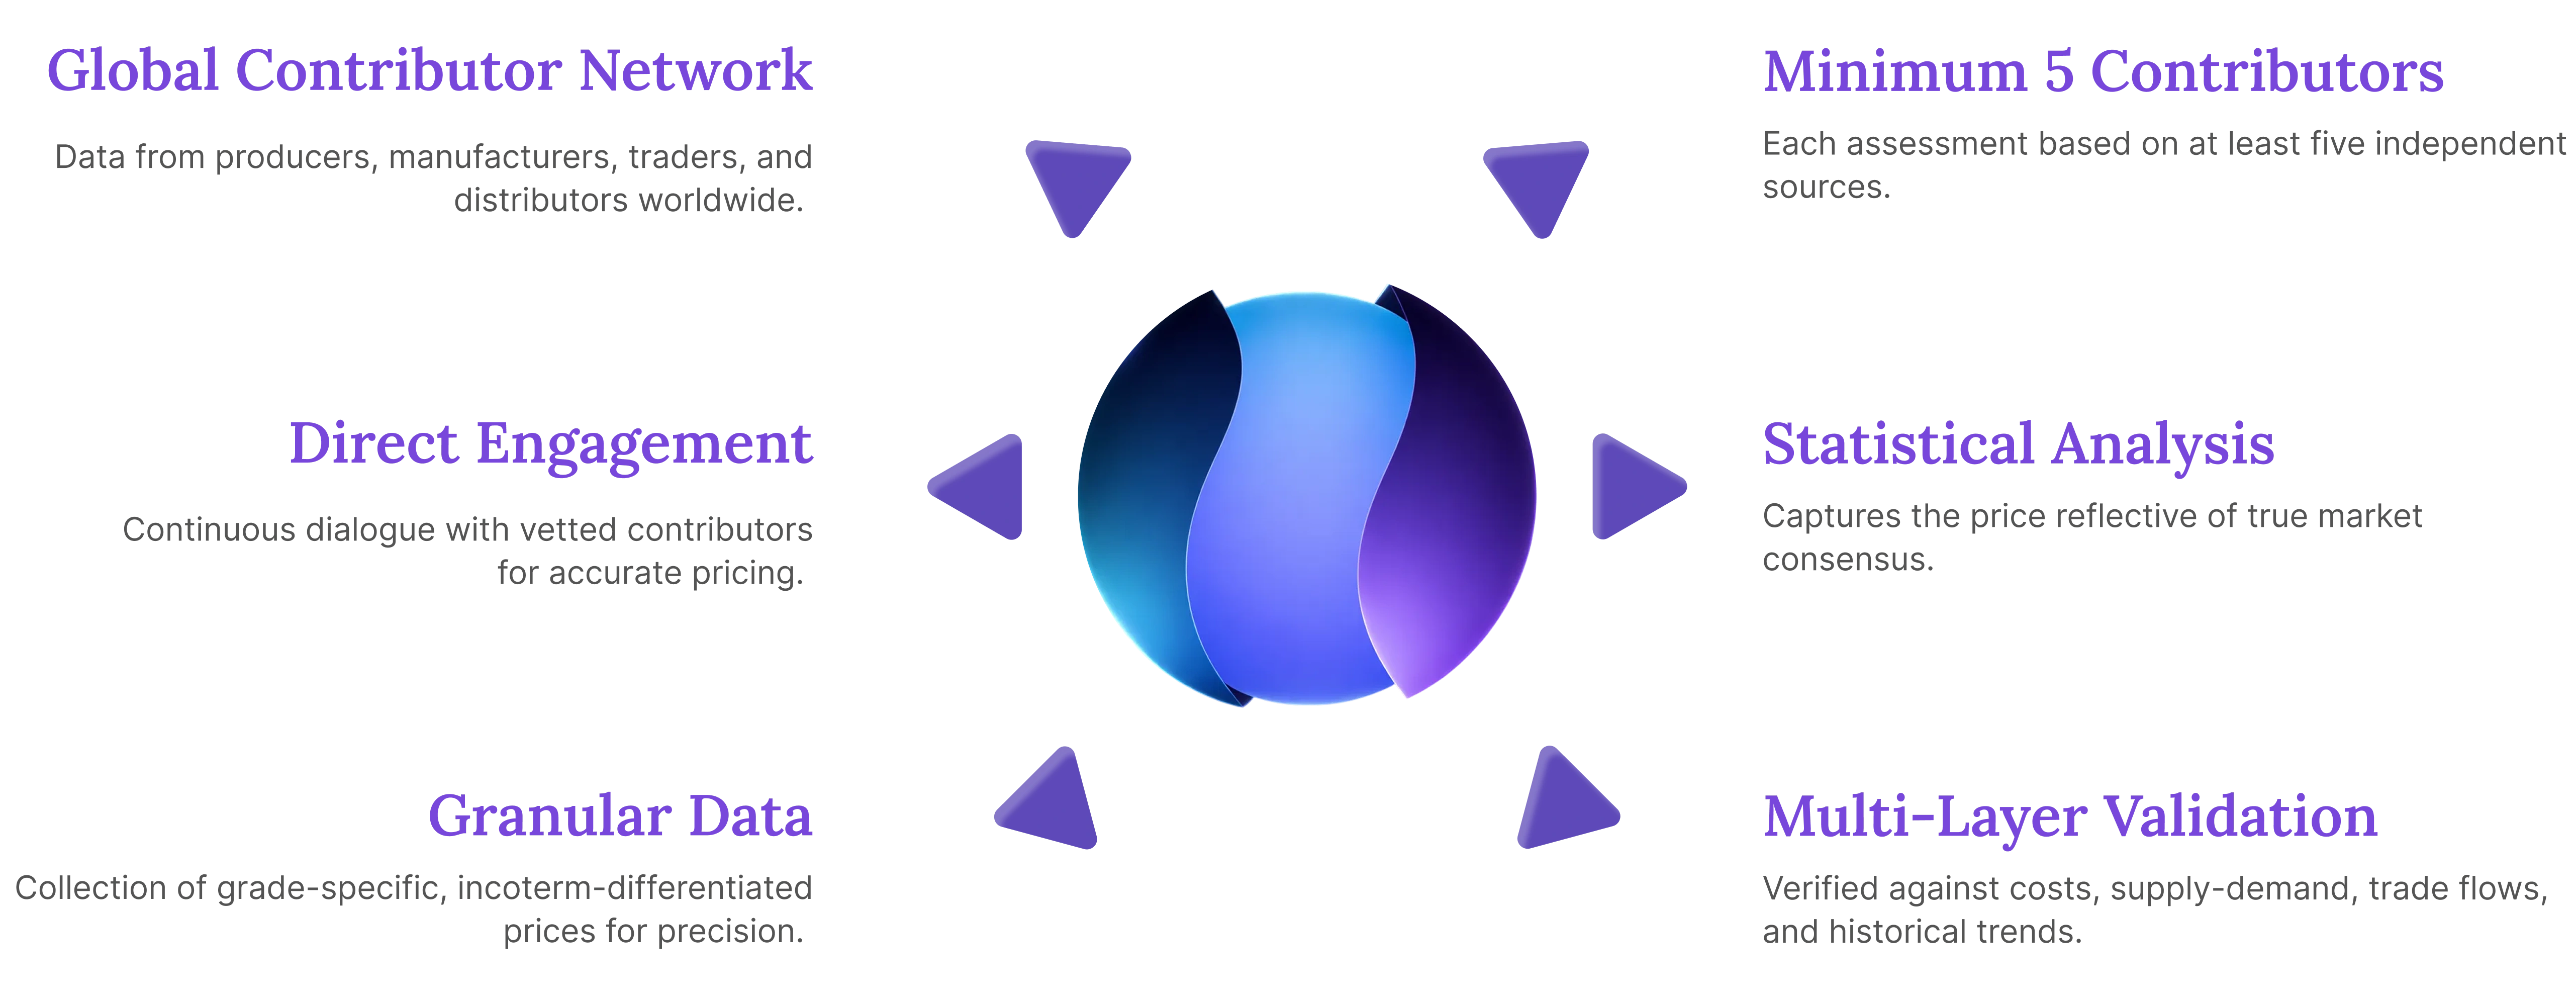
Our Price Analysis Methodology
Schedule A Demo
Experience how Procurement Resource transforms raw material price data into clear, decision ready intelligence. Optimise your performance with reliable, expert market data and analysis. Schedule your demo today to experience a live walk-through where our experts will showcase interactive price charts, forecasted prices, and insights driving the prices for your key commodities, tailored to your workflows. Contact us now!
Our Team will be happy to assist you
We are just a text away
Still Need Help ?
Europe & Africa
+44 7573 171117
Sales@prourementresource.com
USA & Canada
+1 307 363 1045
Sales@prourementresource.com
APAC
+91 8850629517
Sales@prourementresource.com
Subscription Plans
Unlock full access to Procurement Resource's price databases, interactive charts, and short-term forecasts for thousands of commodities. Elevate your sourcing decisions by comparing prices across regions, downloading historical data, and layering in analyst-backed insights, all with our flexible plans that scale as your portfolio grows.
Still have any Questions
Contact Us


Price Trend Dashboard - What's Included
Price trends across a diverse portfolio of categories amd products, spanning board to niche chemicas
Coverage extendable to grade-specific chemicals based on procurement requirements
Regular price tracking supported by robust historical datasets
News, policy updates, and key market drivers impacting price movements
Short-term and long-term price outlooks and forecasts
Supply–demand dynamics and capacity-driven market analysis
- Unlimited Users
- Historical Monthly Price
- USA, Europe, APAC Covered
- Monthly Forecast
- 12 Months validity
- News & Events
- 50 Products (Refer Next Page For List)
Why Procurement Database

Assistance from Experts
Throughout 2024, the Asian acetoin market experienced fluctuating trends with regional variations. Q1 began with moderate price increases driven by supply constraints from Chang Chun Plastics' maintenance shutdown in Taiwan. Post-S...

Client's Satisfaction
Throughout 2024, the Asian acetoin market experienced fluctuating trends with regional variations. Q1 began with moderate price increases driven by supply constraints from Chang Chun Plastics' maintenance shutdown in Taiwan. Post-S...

Assured Collaboration
Throughout 2024, the Asian acetoin market experienced fluctuating trends with regional variations. Q1 began with moderate price increases driven by supply constraints from Chang Chun Plastics' maintenance shutdown in Taiwan. Post-S...
Global Insights
Throughout 2024, the Asian acetoin market experienced fluctuating trends with regional variations. Q1 began with moderate price increases driven by supply constraints from Chang Chun Plastics' maintenance shutdown in Taiwan. Post-S...
1/4