Spend Analytics Tool - Unlock Smarter Spend Decisions
Our Spend Analytics Tool helps organizations gain full visibility into their spend by consolidating procurement, supplier, and category data into one interactive dashboard. By using advanced data models and automated integration, the tool highlights cost drivers, savings opportunities, supplier risks, and compliance gaps.
Whether you want to cut costs, benchmark suppliers, or optimize category strategies, our tool transforms raw spend data into actionable insights—empowering procurement, finance, and leadership teams to make smarter, faster, and more confident decisions.
Achieve up to 3X Savings
Optimize costs, streamline processes, and transform your business with data-driven insights


Key Features of Our Spend Analytics Tool

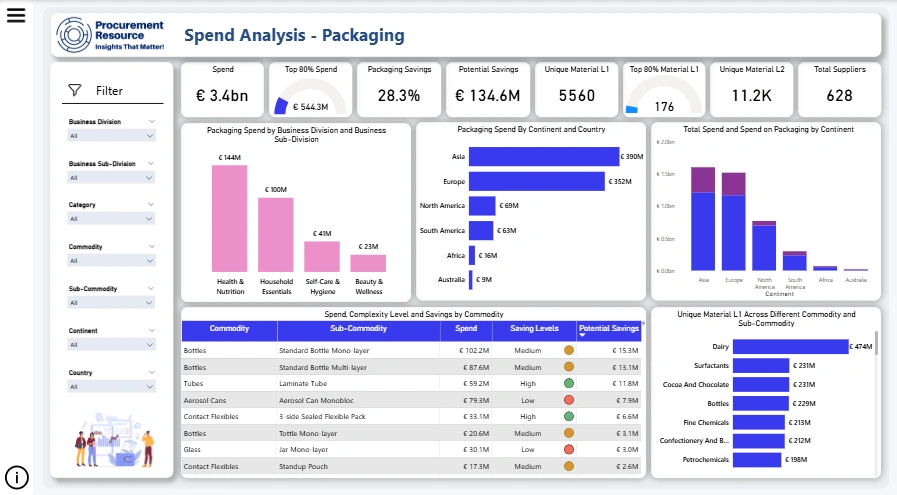
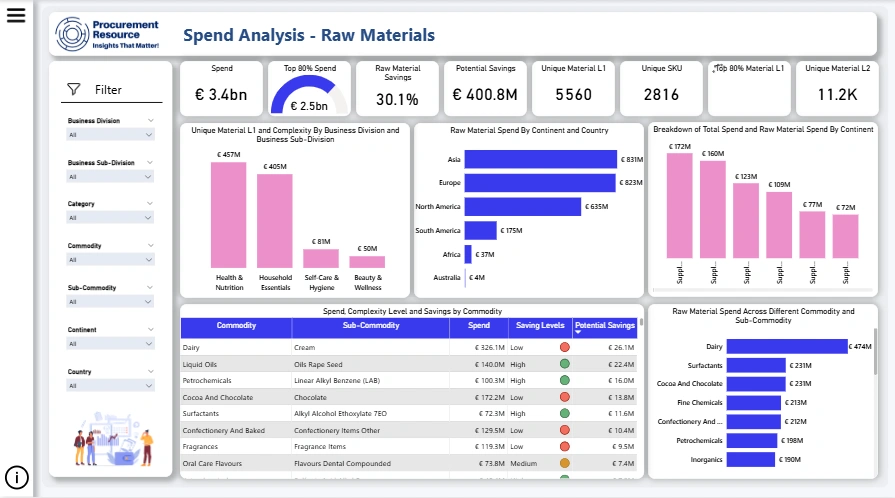
Interactive Spend Dashboards
Track spend by supplier, category, region, and business unit with real-time visualizations powered by Power BI.

Automated Data Integration
ETL pipelines unify data from ERP, invoices, and procurement systems—delivering accurate, cleansed, and categorized spend without manual effort.

Advanced Spend Classification
Uses AI-driven classification to assign spend into categories, sub-categories, and suppliers for improved reporting and benchmarking.

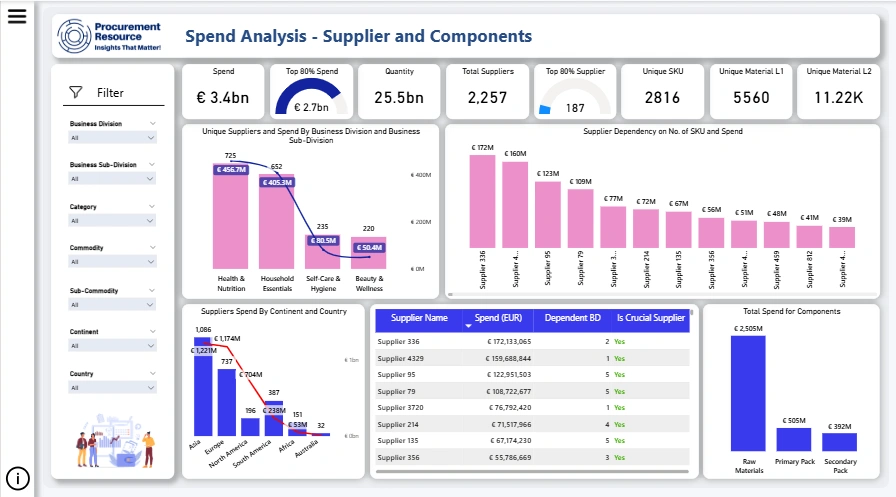
Supplier & Category Insights
Benchmark supplier performance, evaluate category efficiency, and uncover opportunities for consolidation and negotiation.

Tail Spend Management
Identify hidden spend across non-strategic suppliers and low-value transactions, helping regain control and reduce leakage.

Compliance & Risk Tracking
Monitor contract adherence, spot maverick buying, and flag potential supplier risks for proactive risk management.

Scenario Modelling & Savings Forecast
Simulate negotiation outcomes and sourcing strategies to estimate cost savings and performance improvements.

Flexible Deployment & Custom Views
Enable procurement, finance, and strategy teams to access tailored views aligned with their decision-making needs.
Case Studies
Unified Spend Visibility Driving Cost Savings
A client was facing challenges because their spend data was scattered across multiple systems, making it difficult to see where the money was going and identify savings opportunities. Our tool brought all this data together in one place, organized it into clear categories, and highlighted the main cost drivers. As a result, the client achieved over 90% spend visibility, identified 12% potential cost savings, and gained stronger leverage during supplier negotiations.

Schedule A Demo
Struggling with too many SKUs, fragmented sourcing, or complex packaging structures? Let our team walk you through how our Complexity Intelligence Tool simplifies operations, reduces costs, and improves visibility across your supply chain.
Our Team will be happy to assist you
We are just a text away
Our Methodology for Spend Analytics
Our methodology consolidates and cleans spend data across systems, builds clear visibility dashboards, identifies savings and risk opportunities, and delivers actionable roadmaps for cost reduction and supplier optimisation.
Data Prep
Unify ERP, invoice, and supplier data
Classification
Standardize and categorize spend.
Visibility
Interactive dashboards for real-time insights
Opportunities
Spot savings, compliance gaps, and risks
Roadmap
Drive cost savings and smarter sourcing
TESTIMONIAL
What They Say About Us
"Our spend data was scattered across systems, making reporting slow and incomplete. With the Spend Analytics Tool, we gained a single source of truth, cut unmanaged spend by 20%, and identified savings worth 10% of our indirect spend. It has transformed supplier negotiations for us."

Procurement Director
FMCG Company
"Earlier, spend reporting took weeks and was unreliable. Now we have real-time visibility, accurate supplier data, and faster forecasting. We reduced reporting time to days and unlocked 15% savings in indirect categories."
CFO
Global Manufacturing Firm
"We lacked clarity on supplier performance and overlaps. The tool helped us consolidate vendors, improve compliance, and strengthen negotiations. Today, we focus on high-value suppliers while reducing risk and cost."
Head of Strategic Sourcing
Consumer Goods Company